By Dr. Harold McClure, New York City
The Korean National Tax Service on August 27 announced that it is examining the transfer pricing practices of 21 multinationals suspected of transferring large amounts of income earned in Korea to foreign countries without due tax payment.
One multinational in the Korean tax service’s crosshairs is Netflix, a very profitable multinational on a worldwide basis that has incurred losses in Korea. The Korean National Tax Service attributes these operating losses to high management fees, which may be disguised royalty payments.
Netflix began in 1998 with DVD sales and rentals to customers on a subscription service. Its means of distribution evolved to streaming services. Originally, it distributed movies produced by third parties but now produces some of its content. Netflix began its operations in the US but has expanded its operations globally, starting in 2010 with its Canadian operations. Netflix entered Asian markets in 2016.
Worldwide revenues grew from $8.831 billion in 2016 to $20.156 billion in 2019. Revenues grew rapidly in all major regions, including North America, Latin America, Europe, and the Middle East, Africa, and Asia Pacific regions.
Sales for the Asia Pacific region grew from $576 million in 2017 to $1,470 million in 2019. The Asia Pacific region represented only 4.9 percent of worldwide sales in 2017 but had grown to 7.3 percent of sales by 2019.
Korea’s transfer pricing dispute with Netflix
We shall present the worldwide income statement data for Netflix over 22 years from 1998 to 2019 to gain some insights into what the transfer pricing issue between the Korean National Tax Service and Netflix might be.
We shall start with the latest 11 years to gather insights as to the Netflix business in a mature market.
We next consider the financials from 1998 to 2008, which may be suggestive of how entry into a new market might qualify our basic understanding.
Netflix’s worldwide sales grew from $1.67 billion in 2009 to $20.156 billion in 2019. This growth represented both entry into international markets as well as significant growth in North America.
Figure 1 shows Netflix’s gross profits relative to sales and its operating expenses relative to sales for each year. Gross profits represent the difference between revenues and the cost of content.
Operating expenses include marketing expenses, technology development costs, and general and administrative expenses.
Operating expenses averaged just under 26 percent of sales during this period with modest year by year variation. Cost of content varied from as low as 61.72 percent of sales in 2019 to as high as 72.75 of sales in 2012.
The rather stable operating expense to sales ratio is indicative of a mature North America market. The variability of the cost of content relative to sales and hence the gross margin may be due to changes in how Netflix introduced new content in various regions.
In 2012, the 27.25 percent gross margin combined by an operating expense to sales ratio of 25.86 percent led to an operating margin of only 1.39 percent.
By contrast, the operating margin in 2019 was 12.92 percent, as the gross margin was 38.28 percent, while the operating expense to sales ratio was only 25.36 percent.
Over this entire period, operating profits averaged 8.36 percent. The details for operating expenses were as follows:
- Marketing expenses averaged 12.83 percent of sales;
- Technology expenses averaged 8.34 percent of sales; and
- General and administrative expenses average 4.63 percent of sales.
Figure 1: Netflix key financial ratios from 2009 to 2019
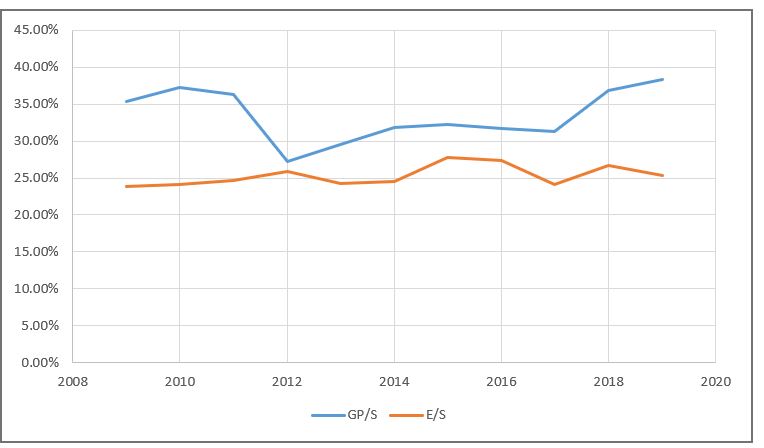
Table 1 poses a transfer pricing model for a Netflix affiliate based on a structure where the affiliate books $100 million in sales, is responsible for paying for the content and marketing expenses.
If the cost of content is 64 percent of sales, then the gross margin is 36 percent. Let’s also assume that local marketing expenses represent 13 percent of sales, so the affiliate’s operating profits before any intercompany payments represent 23 percent of sales.
The US parent incurs both development expenses and general and administrative expenses. Let general and administrative expenses equal 4.6 percent of sales, while development expenses equal 8.4 percent of sales. Under these assumptions, consolidated profits represent 10 percent of sales.
Table 1 considers three intercompany policies showing a combined intercompany (I/C) price charged by the parent to the affiliate for the use of technology as well as the provision of general and administrative services—ideally, separate charges for each intercompany activity.
Table 1: Transfer pricing scenarios for a mature market
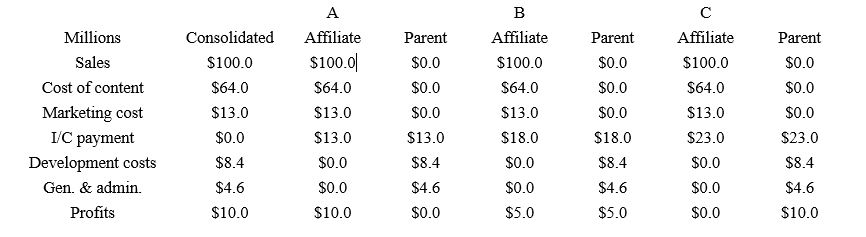
Policy A sets the intercompany charge equal to the cost borne by the US parent, which would leave all of the consolidated profits with the local affiliate.
The IRS would likely assert that the appropriate intercompany pricing policy would set these combined charges such that the US parent would capture a share of these profits.
Policy B would allocate half of the consolidated profits to the US affiliate. For example, let the intercompany management fee be set a $5 million, and the intercompany royalty for the use of technology be set at 13 percent. Under these policies, the intercompany payment would be $18 million.
Policy C would have the US parent charge the local affiliate $23 million, which would allocate all consolidated profits to the US parent. Such a policy would appear extreme, especially if it were involved in terms of a very high fee for management services.
Netflix financials from 1998 to 2008
Netflix incurred operating losses from 1998 to 2002 as its operating expense to sales ratio was very high during its initial years of operations.
Sales were very modest for the first three years but rose to $75.9 million by 2001 and to $152.8 million in 2002.
Gross profits were negative until 2000 when the gross margin was a mere 2.2 percent.
Figure 2 shows that the gross margin reached 36.2 percent before temporarily declining. For this period, gross profits represented sales minus the sum of the cost of content and fulfillment costs.
Figure 2: Netflix key financial ratios from 2001 to 2008
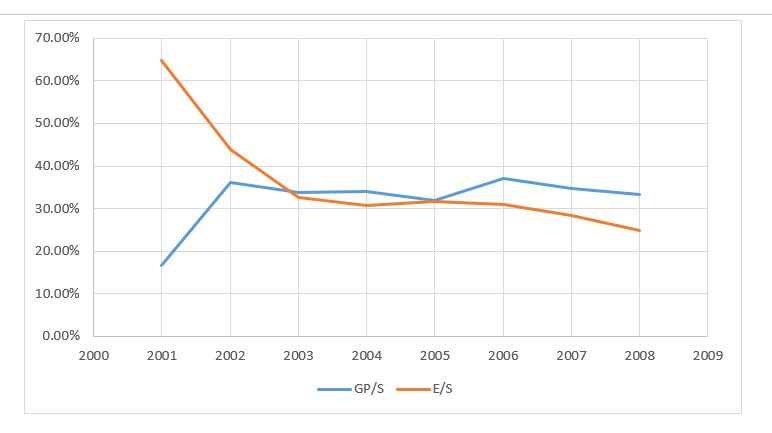
Operating expenses relative to sales were 64.9 percent in 2001 and 43.8 percent in 2002.
The operating expense to sales ratio remained about 30 percent from 2003 to 2006. Even the North American market was not fully mature during the early years of Netflix.
Table 2 presents an alternative financial model for an emerging Netflix market. The structure maintains the assumptions where the affiliate books $100 million in sales, is responsible for paying for the content and for marketing expenses.
Table 2, however, assumes that the cost of content is 67 percent of sales and the gross margin is then 33 percent.
Let’s also assume that local marketing expenses represent 20 percent of sales so the affiliate’s operating profits before any intercompany payments represent 13 percent of sales.
The US parent incurs both development expenses and general and administrative expenses. If general and administrative expenses equal 4.6 percent of sales and development expenses equal 8.4 percent of sales, consolidated profits are zero.
Table 2: Transfer pricing for an emerging market
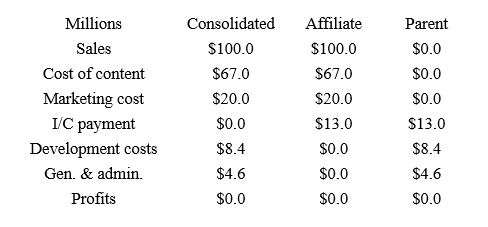
Table 2 assumes that the intercompany charges are $4.6 million for management services and an intercompany royalty rate equal to 8.4 percent of sales. Under this transfer pricing policy, both the local affiliate and the US parent break even.
This scenario illustrates a potential transfer pricing dispute between the Korean National Tax Service and the IRS.
The IRS would likely expect a higher intercompany royalty rate so that the parent could generate profits on the license of intangible assets that are creating high profits in other regions. The Korean Tax Agency, on the other hand, might argue for a lower intercompany royalty by asserting that the local affiliate deserves profits for its routine functions. Korean National Tax Service would be using the logic of the transactional net margin method (TNMM).
TNMM, however, ignores the dynamics of what is essentially a market share strategy, which is described by section 1.482-1(d)(4) of the US transfer pricing regulations.
In certain circumstances, taxpayers may adopt strategies to enter new markets or to increase a product’s share of an existing market (market share strategy). Such a strategy would be reflected by temporarily increased market development expenses or resale prices that are temporarily lower than the prices charged for comparable products in the same market. Whether or not the strategy is reflected in the transfer price depends on which party to the controlled transaction bears the costs of the pricing strategy.
Market share strategies under arm’s length pricing often witness periods where the upfront market expenses are very high relative to early sales such that overall operating expenses exceed gross profits.
As sales grow, the operating expense to sales ratio declines below the gross profit margin, so the local affiliate enjoys sufficient long-run profits to compensate it for both its routine return as well as a reasonable return on its initial investment by incurring the upfront marketing.
Our discussion at best speculates as to what the facts may be with respect to the transfer pricing issues facing the Korean affiliate of Netflix.
The master file and country-by-country reporting for Netflix would ideally provide more insights as to both the key contractual and functional facts for this particular issue as well as the relevant financial data.
Netflix would be well advised to conduct a transfer pricing analysis for this particular issue as the appropriate resolution must satisfy not only the Korean National Tax Service but also the IRS.

Dr. Harold McClure
Dr. J. Harold McClure is a New York City-based independent economist with 26 years of transfer pricing and valuation experience. He began his transfer pricing career at the Internal Revenue Service and has worked for some of the Big Four accounting firms as well as a litigation support entity. His most recent employer was Thomson Tax and Accounting.
Dr. McClure has assisted multinational firms with both U.S. and foreign documentation requirements, IRS audit defense work, and preparing the economic analyzes for bilateral and unilateral Advanced Pricing Agreements.
Dr. McClure has written several articles on various aspects of transfer pricing including the determination of arm’s length interest rates, arm’s length royalty rate, and the transfer pricing economics for mining.
Dr. McClure taught economics at the graduate and undergraduate level before his transfer pricing and valuation career. He had published several academic and transfer pricing papers.
Latest posts by Dr. Harold McClure (see all)
- Norway’s challenge to intercompany loan margins for ConocoPhillips and Exxon - April 11, 2022
- Electricité de France v. France: pricing of intercompany convertible and vanilla debt - March 21, 2022
- ATO prevails in Singapore Telecom Australia intercompany financing litigation - December 20, 2021
- Canada and Alta Energy tax dispute: treaty shopping or valuation under restructuring - November 30, 2021
- Australian Taxation Office’s transfer pricing audit of ResMed: an illustrative model - November 12, 2021


Be the first to comment