By Dr. Harold McClure, New York, NY
Whirlpool Financial Corporation v. Comr. [154 TC. No. 9, May 5, 2020] was a legal decision where the IRS succeeded in declaring income sourced to a Luxembourg affiliate is subpart F income.
Of greater interest, though, are the transfer pricing issues with respect to the Mexican manufacturing affiliate, which were not addressed in this litigation.
The tax planning of Whirlpool harkens back to certain transfer pricing controversies dating back to the 1990s but puts a new twist on the incentives of US based multinationals that assemble components into final goods using maquiladoras.
Section I notes the limited information in the court decision. Section II sets up a reasonable model of the issues based on information noted in the 10-K filings for Whirlpool. Section III explores the role of converting from a contract manufacturer to a toll manufacturer, which may have been the transfer pricing structure before 2009. Section IV addresses certain off-balance-sheet financing issues, which emanate from the classic maquiladora structure and was the Whirlpool Luxembourg play. Our discussion will contrast certain popular transfer pricing approaches with what a reasonable application of sound economics would suggest. Section V offers a few concluding remarks.
Whirlpool’s maquiladora and the 2009 Luxembourg play
Whirlpool acquired Maytag in 2006. At the time of the merger, their combined sales were $19 billion per year, with production being conducted by 60 manufacturing facilities in 12 nations.
Over the 2016 to 2018 period, annual sales were approximately $21 billion. These sales consisted of laundry appliances, refrigerators and freezers, cooking appliances, and other home products. The court noted the legal structure surrounding production in Mexico, where P represents petitioner in this litigation, namely, Whirlpool.
During 2009 P manufactured and distributed household appliances, chiefly refrigerators and washing machines, through domestic and foreign subsidiaries….Through a branch in Mexico, P’s Luxembourg CFC acted as the nominal manufacturer of appliances in Mexico, using a maquiladora structure that qualified for Mexican tax and trade incentives. P’s Luxembourg CFC sold these appliances to P and to P’s Mexican CFC, which distributed the appliances for sale to consumers.
Industrias Acros S.A. de C.V.V. (IAW) was the Mexican affiliate that manufactured laundry appliances and refrigerators. The court noted the following about operations that preceded a 2007 restructuring:
IAW was the manufacturing arm of Whirlpool Mexico. IAW owned land, buildings, and equipment and employed workers who manufactured refrigerators, washing machines, and other appliances (collectively, Products). IAW manufactured these Products at two separate plants in Mexico: the Ramos plant and the Horizon plant. The Ramos plant, located in Ramos Arizpe, Coahuila, produced refrigerators; the Horizon plant, located in Apodaca, Nuevo León, produced washing machines.
IAW owned not only the land and the buildings but also the machinery and equipment needed to conduct toll manufacturing operations on behalf of the US parent before the 2007 reorganization. We later discuss the differences between contract manufacturing versus toll manufacturing when the manufacturing affiliate owns all of the tangible fixed assets.
The court noted the following key features of the 2007 reorganization:
On May 31, 2007, petitioner created Whirlpool Overseas Manufacturing, S.a.r.l (WOM), an entity organized under the laws of Luxembourg. On August 1, 2007, petitioner transferred ownership of WOM to Whirlpool Luxembourg S.a.r.l. (Whirlpool Luxembourg), an indirect wholly owned subsidiary of petitioner likewise organized under Luxembourg law … IAW continued to own the land and buildings used to manufacture the Products. But on various dates during 2007 and 2008 the following transactions occurred: (1) IAW leased to WIN the land and buildings that housed the Ramos and Horizon manufacturing activities; (2) IAW sold to WIN the spare parts, hand tools, and other items needed to support manufacturing activities at those plants; and (3) IAW sold to Whirlpool Luxembourg all of the machinery, equipment, inventories, furniture, and other assets situated within those plants.
The reorganization had two key effects. WOM became the virtual manufacturer as it purchased components and employed IAW as its toll manufacturer. WOM also became the formal owner of the machinery and equipment that IAW utilized in its toll manufacturing activities. We later discuss the transfer pricing implications of this off-balance sheet financing play.
The reorganization had two key effects. WOM became the virtual manufacturer as it purchased components and employed IAW as its toll manufacturer. WOM also became the formal owner of the machinery and equipment that IAW utilized in its toll manufacturing activities. We later discuss the transfer pricing implications of this off-balance sheet financing play.
A financial model for Whirlpool’s maquiladora operations
The 10-K filings for Whirlpool indicate that the cost of production was near $17.5 billion per year for the 2016 to 2018 period or 83.33 percent of sales and operating expenses were near $2.1 billion per year for the 2016 to 2018 period or 10 percent of sales.
As such, consolidated profits represented 6.67 percent of sales. Let’s assume that the typical product cost $1000 to produce and sells for $1200 when a Whirlpool wholesale distributor sold it to a retailer such as Sears.
Let’s also assume that one million products were produced by the Mexican operations. Table 1 establishes a transfer pricing scenario where the distributor incurs all selling costs as well as any operating expenses related to intangible development.
Table 1 also assumes that the transfer pricing policy affords the overall manufacturing operations with a 3.6 markup over total production costs.
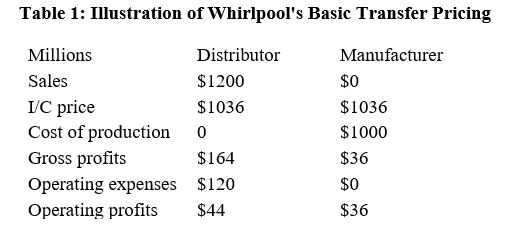
Consolidated operating profits represent $80 per product or $80 million. This policy divided this profit, granting $36 million to the manufacturing operations with the remaining $44 million accruing to the distribution affiliates and owners of any Whirlpool intangible assets.
Before the 2007 restructuring, the transfer pricing tension would be between the IRS versus the Mexican Servicio de Administración Tributaria.
While the Servicio de Administración Tributaria might argue for a higher markup, the IRS could argue for a lower markup. Let’s further assume:
- The cost of components acquired from third parties = $800 per unit;
- The cost of Mexican labor = $200 per unit;
- Working capital represents 20 percent of the cost of components or $160 million; and
- Mexican tangible fixed assets represent 100 percent of labor costs or $200 million.
In other words, total operating assets for manufacturing operations = $360 million or 36 percent of total operating costs. Our assumption that the markup over total operating costs should be 3.6 percent is consistent with a 10 percent return on operating assets.
The cost of capital can be measured as the risk-free rate plus a premium for bearing operational risk. The premium for bearing operation risk is an application of the capital asset pricing model (CAPM).
CAPM holds that the expected return to any asset (Rj) is given by:
Rj = Rf + bj(Rm – Rf ),
where Rf = the risk-free rate, Rm = the expected return on the market portfolio of assets, and bj = the beta coefficient for this particular asset. The beta coefficient measures the tendency of the asset’s return to move with unexpected changes in the return to the market portfolio.
Beta coefficients are often estimated for the equity of publicly traded companies: equity betas, which reflect both operational risk and leverage risk. Since our task is to estimate the expected return to assets rather than the expected return to equity, our beta estimates must be on a debt-free, unlevered, or asset basis.
We shall remove the effect of leverage on these equity betas (be):
ba = be/(1 + D/E),
where D = debt, and E = the market value of equity. To the degree that a company engages in leverage risk by financing its assets through debt instead of equity, the equity beta would tend to exceed its asset or unlevered beta (ba).
If the risk-free rate is assumed to be 4 percent and the market risk premium is assumed to be 5 percent, then the cost of capital is 10 percent if the estimated unlevered beta coefficient is 1.2.
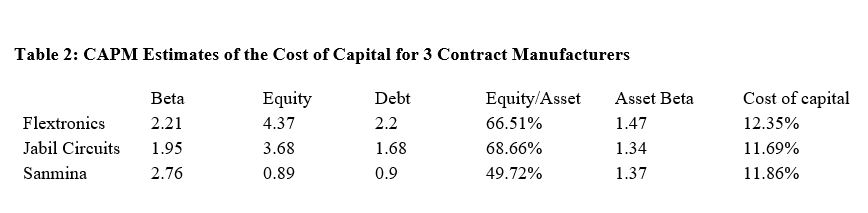
Table 2 shows the derivation of the asset beta three publicly traded comparable contract manufacturers in the electronics sector using the values for the equity beta, debt, and equity as of 2014. We also derive their asset betas, which were typically 1.4.
As such, the estimated cost of capital was near 12 percent for these three third-party electronic contract manufacturers.
Some transfer pricing practitioners have argued that contract manufacturing affiliates should be seen as limited risk entities, which is a very different perspective from what the evidence suggests with respect to the operational risk borne by third party electronic contract manufacturers. It is plausible that the operational risk for a contract manufacturer that assembles refrigerators and laundry appliances is limited, but to argue that their operational risk is minimal is an extreme assumption.
The remainder of this paper assumes ba = 1.2, which provides a case that our 10 percent cost of capital assumption is reasonable.
A model for toll manufacturing
In my discussion of toll manufacturing (“Made in China, Sold by Hong Kong: Processing Trade and Transfer Pricing”, Journal of International Taxation, October 2017), I discuss the conversion from a contract manufacturer that takes title to the components it purchases to assemble finished goods in a publication that gave credit to the former Canadian Revenue Agency (CRA) economist – Dr. Ronald Simkover:
Simkover’s basic argument was that the markup over total costs (m) for a turnkey contract manufacturer should be seen as a weighted average of the return to value-added expenses and the return to pass-through costs:
m = x.v + (1 − x)z
x = ratio of value-added expenses relative to total costs.
v = ratio of operating profits attributable to employing extensive fixed assets relative to labor costs.
z = ratio of operating profits attributable to modest working capital relative to pass-through costs
While a transfer pricing analyst may observe the overall markup over total costs (m), one may find ascertaining the other parameters to be difficult from conventional accounting information. The hypothetical bilateral APA example, however, asserts that x is 50%. The IRS argues for a 10% markup for the consignment contract manufacturer, which implicitly assumes that v = z. The CRA and SAT positions implicitly assume that the markup over pass through costs (z) is zero. Ascertaining what would be reasonable estimates for v and z would require understanding the composition of assets for the third-party allegedly comparable company and providing estimates for the return to these assets.
These markups can be seen as the product of asset intensities times the appropriate return to assets with:
v = Rf(fixed assets/value-added expenses)
z = Rw(working capital/pass through costs)
Rf = return to fixed assets
Rw= return to working capital.
The example above is based on the premise that the overall return to capital for the turnkey manufacturer is 10% and that the fixed assets/value-added expenses is 1.6, while the working capital/passthrough costs is 0.4. If Rw= Rf = 10%, z = 16% and v = 4%. As such, the profits for the toll manufacturer are $8 million, which represents a 16% markup over labor costs. Under the IRS position where profits would be only $5 million, the return to fixed assets would be only 6.25% while the implied return to working capital would be 25%. When viewed in terms of the return to assets, the IRS position is shown to be absurd.The CRA has also argued for a differential return-to-capital approach where Rw< Rf.
SAT represents China’s State Administration of Taxation, which has adopted this type of approach in the evaluation of the appropriate markup for Chinese toll manufacturing affiliates.
Our model for the manufacturing operations of Whirlpool has the ratio of value-added costs to total costs (x) = 20 percent, the ratio of fixed assets to labor cost = 100 percent, and the ratio of working capital to pass through costs = 20 percent.
Table 3 considers several possible markups over labor costs for the toll manufacturing affiliate.
The first column of table 3 assumes that the markup over labor costs should be the same 3.6 percent markup for the contract manufacturer that took title to the components, which absurdly assumes v = z even that the ratio of fixed assets to labor costs is considerably higher than the ratio of working capital to pass through costs.
Notice that in this clearly erroneous approach, the return to fixed assets for the toll manufacturer is only 3.6 percent. If we assume that Rf = Rw = 10 percent, then the appropriate markup overall labor costs would be 10 percent.
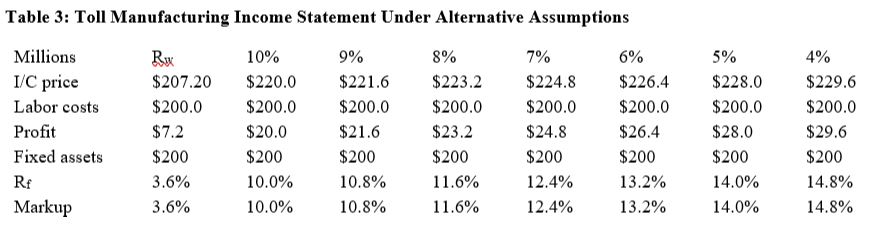
The Chinese SAT has argued for an approach based on a lower return to working capital (Rw). Let’s assume that the overall cost of capital for a contract manufacturing that takes title to the components is 10 percent, and Rw is only 5 percent. In this case, Rf = 14 percent and the appropriate return to labor costs would be 14 percent. Table 3 presents the results of assuming alternative values for Rf, ranging from 4 percent to 10 percent.
The off-balance nature of the classic maquiladora structure
The correct application of the toll manufacturing model would suggest a markup over labor costs that would be at least 10 percent in our Whirlpool example if the Mexican toll manufacturer owned all of the tangible fixed assets, including land and buildings as well as machinery and equipment.
Let’s further assume the following: the value of land and buildings owned by IAW = $50 million, and the value of machinery and equipment owned by IAW before the restructuring = $150 million. As part of the restructuring, the formal ownership of the machinery and equipment was transferred to WOM.
Let’s also assume that Rw = Rf = 10 percent, which would imply that before the restructuring IAW should receive $20 million in profits as the toll manufacturer, while the virtual manufacturer (WOM as a result of the restructuring) would retain $16 million for its ownership of the working capital.
The transfer of the machinery and equipment was designed to further erode the profits of IAW in favor of WOM by having three-fourths of the value of fixed assets be formally owned by WHO.
Several transfer pricing practitioners would argue that the appropriate profits for IAW would be lowered to $5, representing a 2.5 percent markup over labor costs, while the profits for WOM should rise to $31 million. This argument is not only aggressive but also violates basic financial economics with respect to off-balance sheet financing.
It is odd that the court decision noted that IAW leased the land and the buildings that it owned and operated. A lessor is the formal owner of assets that the lessee utilizes. As such, IAW owned and operated the building and property, and it operated the machinery and equipment formally owned by WOM. WOM was effectively leasing the machinery and equipment to IAW
The seminal paper on the economics of leasing was written by Merton Miller and Charles Upton (“Leasing, Buying, and the Cost of Capital Services”, Journal of Finance, June 1976). Leasing is an alternative to purchasing assets with debt financing. In fact, financial leases are seen as equivalent to owning the asset via debt financing in the sense that the lessee incurs all operating risks, whereas the lessor receives a guaranteed return over the life of the asset.
Miller and Upton note, however, that the lessor bears the risk of obsolescence when the lease term is shorter than the economic useful life of the asset. They also provide a CAPM model for the expected return to the owner of the asset:
Rj = Rf + bl(Rm – Rf ),
where Rf = the risk-free rate, Rm = the expected return on the market portfolio of assets, and bl = the asset beta coefficient for a pure play leasing company.
As an example, let Rf = 4 percent and Rm = 5 percent. If bl = 0.4, then the premium for bearing obsolescence risk is 2 percent, and the expected return for a leasing company would be 6 percent.
We have assumed that a manufacturer that owns all of the assets that it utilizes would receive a return to assets equal to 10 percent. This model is consistent with a CAPM approach where Rf = 4 percent, Rm = 5 percent, and the asset beta for manufacturers (b) is 1.2.
The taxpayer’s argument is often that the maquiladora deserved labor cost plus 2.5 percent or $5 million as this intercompany policy would afford the maquiladora with a 10 percent return on the assets that it formally owns.
The Mexican SAT could argue for a markup over labor costs equal to 10 percent on the grounds that the maquiladora deserved a 10 percent return on all assets that it utilizes whether the maquiladora formally owned these assets or not.
Neither extreme view is supported by our leasing model, which notes that the contract manufacturer is entitled to some of the return attributable to the machinery and equipment as it incurs at least a portion of the systematic risk from utilizing this equipment.
Neither extreme view is supported by our leasing model, which notes that the contract manufacturer is entitled to some of the return attributable to the machinery and equipment as it incurs at least a portion of the systematic risk from utilizing this equipment.
If the formal owner of the machinery and equipment is entitled to not only a risk-free return but also an additional 2 percent premium for bearing the risk of ownership, then the profits attributable to the machinery and equipment are split between the formal owner and the maquiladora such that the maquiladora receives an expected return of 4 percent for the bearing of commercial risk incurred by utilizing this machinery and equipment owned by the parent corporation. Under our assumptions, the maquiladora is entitled to a 10 percent return on the P&E and an additional 4 percent return on the M&E, with its overall profits being 10%($50 million) + 4%($150 million) = $11 million.
In other words, the appropriate markup over labor costs would be 5.5 percent. The expected return to the plant and property (P&) owned by IAW would be 22 percent reflecting the fact that it bears the commercial risk on all fixed assets, while WOM only bears ownership risk and the machinery and equipment.
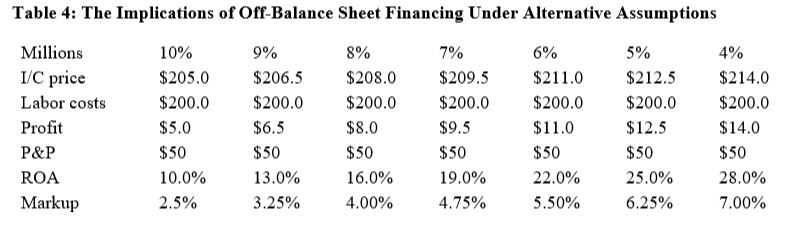
Table 4 considers other possible assumptions for bl and the implications for the expected return to the formal owner of the machinery and equipment. For example, if bl = 0, then the lessor would receive only the risk-rate = 4 percent. In this case, the appropriate markup over labor costs would be 7 percent.
Concluding comments
The battle over the appropriate markup for toll manufacturing affiliates of US parents in either Canada or Mexico has been controversial if not confusing issue for well over a generation.
In the 1990s, any shift of income out of Canada or Mexico income represented an increase in US taxable income. While the off-balance sheet play was often present for maquiladoras, the more conservative planning play, where the toll manufacturer owned all of the fixed assets but not the working capital, was prevalent for Canadian toll manufacturers.
US parents striving to reduce Mexican income were more aggressive both in terms of using this off-balance sheet play but also implied absurdly low returns for the few assets formally owned by the maquiladora in light of the commercial risk these entities bore.
The SAT rightfully objected, but alas, ended up making this issue more complicated than necessary. The SAT also offered a safe harbor where the Mexican affiliate would receive a 6.9 percent return on all assets, including not only all fixed assets but also the inventories, even if they were owned by the virtual manufacturer.
The court decision notes a variety of changes in the nature of international tax law facing maquiladoras, including the special 17 percent tax rate for maquiladoras under certain conditions.
This reduced tax rate may have temporarily reversed the incentives for US parents to reduce maquiladora profits as long as this issue was a battle between sourcing the profits in Mexico versus the US.
Whirlpool, however, made the virtual manufacturer a Luxembourg affiliate that faced no income taxes on its income as long as the IRS could not make this income taxable in the US under subpart F.
If such a play of no taxes anywhere on income received by the Luxembourg affiliate be legally sustainable, then the incentives to reduce maquiladora income will become more enticing than ever.
The court decision did not discuss the transfer pricing aspects for this Whirlpool maquiladora play, so we do not know what their policies were or how they proposed to defend these policies.
Our discussion, however, has covered some of the past controversies as well as presented a model of arm’s length pricing under sound economic principles.

Dr. Harold McClure
Dr. J. Harold McClure is a New York City-based independent economist with 26 years of transfer pricing and valuation experience. He began his transfer pricing career at the Internal Revenue Service and has worked for some of the Big Four accounting firms as well as a litigation support entity. His most recent employer was Thomson Tax and Accounting.
Dr. McClure has assisted multinational firms with both U.S. and foreign documentation requirements, IRS audit defense work, and preparing the economic analyzes for bilateral and unilateral Advanced Pricing Agreements.
Dr. McClure has written several articles on various aspects of transfer pricing including the determination of arm’s length interest rates, arm’s length royalty rate, and the transfer pricing economics for mining.
Dr. McClure taught economics at the graduate and undergraduate level before his transfer pricing and valuation career. He had published several academic and transfer pricing papers.
Latest posts by Dr. Harold McClure (see all)
- Norway’s challenge to intercompany loan margins for ConocoPhillips and Exxon - April 11, 2022
- Electricité de France v. France: pricing of intercompany convertible and vanilla debt - March 21, 2022
- ATO prevails in Singapore Telecom Australia intercompany financing litigation - December 20, 2021
- Canada and Alta Energy tax dispute: treaty shopping or valuation under restructuring - November 30, 2021
- Australian Taxation Office’s transfer pricing audit of ResMed: an illustrative model - November 12, 2021


Be the first to comment