By Dr. J. Harold McClure, New York City
Multinational manufacturer and marketer of pressure-sensitive materials, Avery Dennison Corporation, on March 31, won its transfer pricing dispute with the Chilean tax authority.
The case, Chile vs. Avery Dennison Chile S.A. (Tax Court, Case N RUT 96.721.090-0), concerns the appropriateness of Avery Dennis’s intercompany loan interest rates and the price of goods sold to its Chilean affiliate.
Intercompany interest rate
The Chilean tax authority challenged interest rates on loans from Chilean affiliate, Avery Dennison Chile S.A, to Luxembourg affiliate, Avery Management KGAA.
Avery Dennison Chile made two US dollar-denominated one-year intercompany loans to Avery Management KGAA: a $3.2 million loan on November 24, 2010, and a $1.1 million loan on June 1, 2011.
The intercompany interest rate on both loans was 0.79 percent. The rates were established by management and corresponded to a fixed-rate loan in US dollars, with interest calculated based on a 360-day year.
Avery Dennison used the comparable uncontrolled price method to compute the interest rate. An arm’s length range was obtained using a 12-month Libor rate. For 2010, the minimum was 0.77 percent, the maximum was 1.19 percent, and the median was 0.90 percent. For 2011, the minimum was 0.73 percent, the maximum was 0.79 percent, and the median was 0.77 percent.
Interest rates on both one-year US government bonds and on 12-month LIBOR were quite low and exhibited moderate variability during 2010 and 2011. Our figure shows these interest rates for November 1, 2010, to June 30, 2011. Over the entire two-year period of 2010 and 2011, the average 12-month LIBOR was 0.88 percent, and the average interest rate on one-year government bonds was 0.25 percent.
The notion of a range of arm’s length interest rate derived from the volatility of interest rates over a period is quite strange as the 12-month LIBOR was 0.77percent on November 24, 2010, and 0.73 percent on June 1, 2010. The interest on one-year government bonds was 0.28 percent on November 24, 2010, and 0.18 percent on June 1, 2010.
The tax authority argued that the taxpayer’s analysis justifying the rate of 0.79 percent was incorrect because the 12-month Libor rate is a reference rate based on the interest rates at which a group of banks in London offer funds to other banks in the interbank market, and in practice operates as a risk-free rate.
The tax authority argued that the capital asset price model (CAPM) indicates that the rate of return that any company, project, or asset must provide must be a function of a risk-free rate and a spread for the inherent risk of that company, project, or asset. Thus, financial theory indicates that the expected return on a deposit should contain at least the return of a risk-free rate and a spread for the risk of default or non-payment by the counterparty.
12-month LIBOR and one-year government bond rates from November 2010 to June 2011
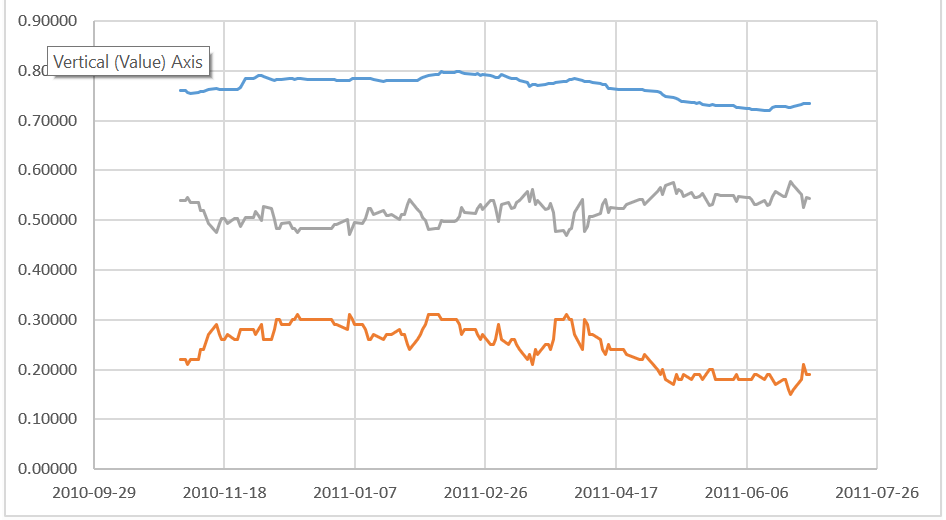
The tax authority’s argument includes two non sequiturs. The first is the premise that LIBOR rates are risk-free rates. In fact, the market evidence shows that 12-month LIBOR rates exceeded the government bond rate by approximately 0.5 percent during the dates of the two intercompany loans. The other confusion in the tax authority’s position is that CAPM can capture the expected loss from default. CAPM, however, is designed to measure the premium return for the assets of a company for bearing systematic operational risk.
An appropriate analysis would estimate the credit rating for the borrowing affiliate and then translate that credit rating into an appropriate credit spread.
For example, if the credit rating for the borrowing affiliate were Standard and Poor’s A, the credit rating would likely be 1 percent, which would require a loan margin of only 0.5 percent since 12-month LIBOR rates already incorporated a spread near 0.5 percent. If, however, the appropriate credit rating were AAA, then no loan margin would be required.
Analysis of the distributor’s margin
The tax authority also proposed a decrease in the intercompany prices paid for goods by Avery Dennison Chile S.A., equal to approximately 425 million Chilean pesos per year, which translates into $850 million given the exchange rate at the time, which was approximately 500 Chilean peso per dollar.
Table 1 presents the financials for Avery Chile under its transfer pricing policy and under the transfer prices proposed by the tax authorities based on the information noted in the court record.
The court record noted that the Chilean affiliate’s gross margin was 16.35 percent and its operating profits were only 0.05 percent of sales, which implies that operating expenses represented 16.3 percent of sales.
The table represents the position of the tax authority to be that the operating margin should be closer to 4.3 percent, which would require a 20.6 percent gross margin. Given the proposed transfer pricing adjustment size, we have reasonably assumed that sales were 10 billion Chilean pesos or $20 million per year.
Table 1: Illustration of Avery Dennison Chile’s tangible goods issue
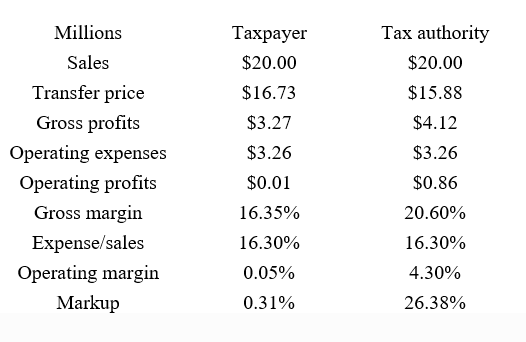
While the taxpayer’s policy would be consistent with a markup over operating expenses of only 0.31 percent, the tax authority’s position is consistent with a 26.38 percent markup over operating expenses.
The taxpayer relied on an analysis of gross margins by Ernst & Young, which insisted its analysis was consistent with the resale price method (RPM). The tax authority’s position was based on an application of the transactional net margin method (TNMM). There was also some disagreement on the selection of publicly-traded distributors to be used as alleged comparables. Both parties selected office supply distributors, including Office Depot, Office Max, Staples, and United Stationers. Both parties also selected Bunzl Plc, which is a UK distributor of consumer products.
The taxpayer also selected as comparables some companies engaged in the distribution of chemicals and other activities. Aceto also distributes pharmaceutical products. Ashland and Hawkins not only distributes chemical products but also manufacture some of their products.
Table 2 presents the average annual financials in 2010–2012 for these three companies. The reported gross margins for Aceto and Hawkins were higher than 16.35 percent even though their operating expense to sales ratios were lower than 16.3 percent.
The gross margin for Ashland was substantially higher. As such, these three companies’ financials do not defend the taxpayer’s intercompany policy even under RPM. It is interesting to note that the tax authority did not consider these companies as appropriate comparables for this issue.
Given that Ashland and Hawkins had manufacturing operations raises questions about why Ernst & Young included these two companies. Manufacturing operations often report the direct cost of labor in costs of goods sold, which would suggest that the reported gross margins understate the difference between sales and cost of purchases. Aceto’s high return to operating expenses could be seen as attributable to its pharmaceutical products’ sales.
As such, our focus will be on the financials for the other five companies chosen by Ernst & Young and the three additional proposed comparables chosen by the tax authority.
The tax authority did not include the three distributors of chemicals but did include three distributors of electronic goods – Arrow Electronics, Avnet, and Surge Components.
Table 3 presents the average annual financials over the 2010–2012 period for these three companies as well as the financials for Bunzl and for the four distributors of office products, including Office Depot, which for some odd reason was not in the tax authority’s set of alleged comparable companies.
Table 2: Income statements for 2012–2014 of three chemical distributors
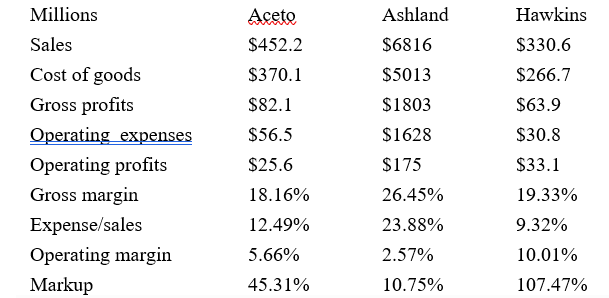
Table 3: Income statements for 2012–2014 for the other eight distributors
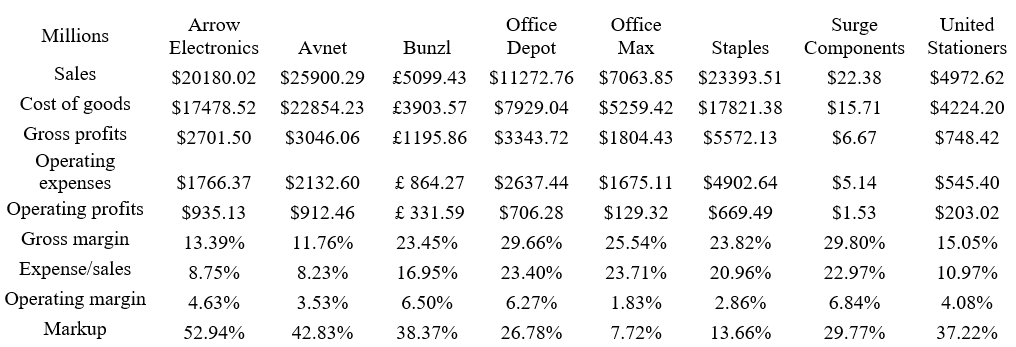
The gross margins for Bunzl, three of the office supply distributors, and Surge Components were all higher than the gross margin for Avery Dennison Chile.
For four of these five companies, the operating expense to sales ratio exceeded 20 percent. The tax authority reasonably argued that a comparison of gross margins under the RPM using such companies would be misleading unless an adjustment for the additional function responsibilities of the third-party companies relative to Avery Dennison Chile was performed. The TNMM can be seen as a modified RPM that accomplishes the functional responsibility adjustment either by using an operating margin or a return to operating expense (markup) approach.
The only comparable selected by Ernst & Young that had a lower gross margin than Avery Dennison Chile was United Stationers. Arrow Electronics and Avnet also had modest gross margins. Each of these three companies also had lower operating expense to sales ratios than Avery Dennison. The central tendency for the operating margins for these three companies was approximately four percent, while the markup over operating expenses ranged from 337.22 percent to 52.94 percent.
The court suggested the only reasonable comparable was Bunzl, which has a similar operating expense to sales ratio as Avery Dennison Chile. Its gross margin was 23.45 percent, and its operating margin was 6.5 percent in 2012–2014.
Ernst & Young asserted that this evidence provided a range of gross margins from 7.25 percent to 29.85 percent. The higher gross margin represents the gross margin for Surge Component. It is unclear how their analysis derived 7.25 percent since our review based on the 10-K filings for the US-based companies and Bunzl’s annual report noted gross margins all in excess of 11.75 percent.
This use of the RPM did not adjust for the functional differences between Avery Dennison Chile and the third-party distributors, but the court record noted adjustments for differences in asset intensities. According to the court, to eliminate fundamental differences in the levels of working capital between the companies, adjustments were made to the profitability of the comparable companies considering the levels of accounts receivable, accounts payable, and inventories. While these adjustments are important, their quantitative importance pales in comparison to the need to account for differences in functions, especially in situations with such very wide differences in the operating expense to sales ratio.
The Ernst & Young application of the RPM failed to perform this crucial adjustment. According to the court, the taxapayer argued that the RPM appropriate, as it is the most direct method applicable to the margins observed at gross levels, in addition to concentrating the main intercompany transaction, i.e., the purchase of finished products for resale, at the cost of sale level. The taxpayer, therefore, argued that the Service erred in using the TNMM since what generated a reduction in operating margins is not related to an increase in the acquisition costs of the products that are subsequently resold, but rather to a decrease in the selling prices of those products and the circumstances that led it to make that determination.
While I have similarly advocated using the modified version of the RPM that properly accounts for not only differences in asset intensities but also functional differences, the use of the RPM with only adjustments for difference in asset intensities is unwarranted. This passage, however, hints at a couple of possibilities that might explain a temporary reduction in operating margins under the arm’s length standard.
One possibility would arise from a period of weak sales where the distributor’s operating expense to sales temporarily arises about what I have called the normalized operating expense to sales ratio.
This passage, however, suggests that the low gross margin is due to a period of lower prices from customers. Such price risk may be borne by third-party distributors, but the typical application of the RPM generally assumes price risk is borne by the related party supplier. An alternative theory of this case might be that Avery Dennison Chile was engaged in a market share strategy to increase sales in Chile.
The appropriate presentation of such an argument cannot be reliably captured either by a TNMM or an RPM analysis.

Dr. Harold McClure
Dr. J. Harold McClure is a New York City-based independent economist with 26 years of transfer pricing and valuation experience. He began his transfer pricing career at the Internal Revenue Service and has worked for some of the Big Four accounting firms as well as a litigation support entity. His most recent employer was Thomson Tax and Accounting.
Dr. McClure has assisted multinational firms with both U.S. and foreign documentation requirements, IRS audit defense work, and preparing the economic analyzes for bilateral and unilateral Advanced Pricing Agreements.
Dr. McClure has written several articles on various aspects of transfer pricing including the determination of arm’s length interest rates, arm’s length royalty rate, and the transfer pricing economics for mining.
Dr. McClure taught economics at the graduate and undergraduate level before his transfer pricing and valuation career. He had published several academic and transfer pricing papers.
Latest posts by Dr. Harold McClure (see all)
- Norway’s challenge to intercompany loan margins for ConocoPhillips and Exxon - April 11, 2022
- Electricité de France v. France: pricing of intercompany convertible and vanilla debt - March 21, 2022
- ATO prevails in Singapore Telecom Australia intercompany financing litigation - December 20, 2021
- Canada and Alta Energy tax dispute: treaty shopping or valuation under restructuring - November 30, 2021
- Australian Taxation Office’s transfer pricing audit of ResMed: an illustrative model - November 12, 2021


Be the first to comment