By Dr. Ednaldo Silva, founding director of RoyaltyStat®, Bethesda, Md.
The US Tax Court accepted the IRS foreign affiliate “contract manufacturing” theory in the Coca-Cola v. Commissioner decision, issued Nov. 18, 2020.
As Cambridge doyen economist Joan Robinson (1903-1983) used to say, “she who is convinced against her will is of the same opinion still.”
Coca-Cola owned intangibles used to manufacture, market, and distribute Coca-Cola products worldwide. The intangibles include “trade” and “marketing” intangibles, such as patents, secret formulae, logos, and trademarks.
The foreign manufacturing affiliates (called “supply points”) license-in the intangibles from the US corporation to produce concentrates and syrups, which they sell to “independent” bottlers.
Of the 24 “independent” bottlers “used as comparables” for the supply points, 14 carry the Coca-Cola trade name. Thus, it is questionable if they satisfy the independence conditions under Regs. § 1.482-1(i)(4) and (5). According to those regs, “[c]ontrolled includes any kind of control, direct or indirect, whether legally enforceable or not, and however exercisable or exercised”.
During Coca-Cola’s 2007–2009 IRS audit, the supply points (or licensees) were expected to compensate the US corporation (licensor) using a formula agreed with the IRS (1996 accord, also called the 10-50-50 formula), covering the prior audit years 1987–1995. The court notes that the petitioner did not memorialize the terms of the IRS 1996 accord in written agreements with the supply points.
Exhibit 1 shows my calculations of the outbound royalties owed by the supply points under the IRS 1996 accord. My exhibit also shows the IRS adjusted super-royalty, sanctioned by the court.
I question the IRS winning position and the court’s opinion.
The IRS 1996 accord “routine” operating profits can be written as follows:
(1) Y(t) = 0.1 S(t)
where Y(t) is the prescribed “routine” operating profits, and S(t) is the net sales (revenue) of the supply points in year t = 2007, 2008, and 2009. The agreed operating profit margin (called ROS, return on sales) was 10%, which produces a similar profit markup.
The court states that two petitioner (Coca-Cola) experts agreed with the IRS that the arm’s length “routine” operating profit margin of the supply points was μ = 8%, which I find, for reasons discussed below, incomprehensible.
The IRS 1996 accord royalty formula can be written as follows:
(2) R(t) = 0.5[μ S(t) − 0.1 S(t)], which can be simplified:
(3) R(t) = (0.5 μ − 0.05) S(t)
where R(t) is the outbound royalty amount, and μ is the actual operating profit margin (μ = ROS) reported by the supply points per year during the audit in dispute. The prescribed “routine” profit margin under the IRS 1996 accord is really 5%, and not 10%.
Exhibit 1 shows that the three-year sum of the IRS 1996 accord royalties was $4.189 billion, using the agreed formula (3), which results in a three-year weighted average royalty rate of 13.2%.
Hereafter, I focus on Brazil, as the IRS 1996 accord implies that the supply point in Brazil, together with Ireland, suffered the biggest IRS section 482 operating profit adjustments.
The IRS 1996 accord implies that the applicable outbound royalty rates payable by the Brazil supply point would be 24.3% in 2007, 24.6% in 2008, and 24% in 24%.
The statutory outbound royalty rate in Brazil is 5%, so the IRS 1996 accord could not, in my non-legal opinion, be satisfied. The escape would be to embed (hide) the royalty payment inside other controlled outbound payments (outside of dividends), which was illegal, in my non-legal opinion. I shall not trespass into the dispute over Regs. § 1.482-1(h)(2) (Foreign legal restrictions).
One economic issue that perdures (not discussed by the court) is why the supply point in Brazil retained such large amounts of cash and equivalents, by supposed underpayments of the IRS 1996 accord royalties, when Brazilian entities are subject to higher consumer price inflation rates than the US, and cash held in Brazilian Real may be subject to foreign exchange devaluations when converted into USD.
The local supply point could not hold Brazilian checking accounts in USD, and any local entity with excess cash (or USD accounts payable or USD interest on foreign debt) would be advised to convert the local Brazilian Real accounts into USD in fear of devaluations (probable foreign exchange loss).
The Brazilian supply point held the highest percentage of cash and equivalents to total assets, compared to the other supply points, averaging 42.2% of total assets in 2007–2009. Tax haven Ireland held 16.2% in cash. Likely, the Brazil supply point faced local restrictions remitting above the statutory royalties to the US corporation, but this issue is deferred in the court opinion.
Except for Ireland, the supply points are in developing countries under weak currencies, which foreign exchange dealers tend to avoid. Weak currencies are not likely to be held as reserves by foreign central banks. Again, except for Ireland, none of the countries where the supply points operate are tax havens.
Super-royalties
Examining the US corporation’s 2007–2009 federal tax returns, the IRS determined that the 1996 accord did not reflect the arm’s-length standard because it under-compensated the licensor for the use of the intangibles.
The IRS modified the 1996 accord to the new super-royalty based on the licensor collecting 100% of the excess operating profits of the supply points:
(4) R(t) = (μ − 0.1) S(t)
where (as a reminder) μ is the actual profit margin (ROS) reported by the local supply point. See Exhibit 1.
Equation (4) means that the IRS forced the supply points to pay the outbound royalty equivalent to 100% of the annual excess operating profits above the prescribed “routine” operating profit margin of 10%. Because of location savings, the obligatory 10% operating profit margin is unlikely to be arm’s length. See Silva (2019).
The IRS super-royalty formula (4) implies that the total outbound royalty payments of the supply points for the audit years 2007–2009 increased to $8.378 billion, twice the $4.189 billion three-year royalty sum of the IRS 1996 accord.
In Brazil, the outbound super-royalty rate (expressed as a proportion of revenue) jumped to 48.7% in 2007, 49.3% in 2008, and 48% in 2009. These are extraordinary royalty rates (outliers) if a large sample of uncontrolled license agreements is used to test the IRS adjustments’ reasonableness.
The court’s often-repeated view that the Coca-Cola intangibles are “unique” (implying, without falsifiable evidence, that the licensed intangibles cannot be evaluated using external license agreements) can hold by fiat, against the Anglo-American empiricist tradition back to Francis Bacon (1561–1626), John Locke (1632–1704), and David Hume (1711–1776).
“Unique” intangibles are not consistent with the fact that the Coca-Cola registered products have many substitutes, including coffee drinks. I defer this issue to another occasion.
Given the outbound 5% royalty rate restrictions in Brazil, the IRS’s court-sanctioned adjusted 49% super-royalty rate cannot be paid to the US unless political insolence overrules the local tax administration.
Contract manufacturer theory
Not knowing the court details, I am surprised that two petitioner’s experts agreed with the IRS theory (economic fiction) that the supply points are contract manufacturers, expected to earn an 8% or 10% “routine” operating profit markup per year.
The Brazilian supply point shows acquired intangibles on its balance sheet, but the IRS view and the court confirmation allow no recompense for such accounts.
The court says little about using comparable royalty rates to assay the reasonableness of the IRS-adjusted super-royalty rates. As stated, in another setting, I shall discuss this issue and the unreliable IRS return on asset approach to determine so-called arm’s length royalty rates.
Here, I question if the supply points can be regarded (based on the court’s description of facts) as contract manufacturers, expected to earn only “routine” return on operating assets, because they operate as local (or regional) monopolies.
Monopoly supply points cannot be compared with companies operating at a lower level of the wholesale trade markets. The court’s accepted notion that the supply points can be destitute of the licensed intangibles at will is unconvincing. No frequency of such occurrence is given as probative evidence, just hearsay.
The profit margin of monopolies is expected to be higher than the profit margin of oligopolies (“comparable” bottlers) and higher still than the routine profit margin of companies operating under competition (another economic fiction).
The IRS chosen bottlers (“comparables” to the supply points) are reproduced on Exhibit 2, except that I calculated the assets turnover of the DuPont formula.
Exhibit 2 shows minor discrepancies compared to the IRS tables in the court opinion (pp. 80-81, 136), which I attribute to rounding errors (except for Hokkaido Coca Cola Bottling Co., Ltd. (Japan), where the IRS table has ROA = 1.6%, and my table has ROA = 1.1%, and Compania Nortena de Bebidas Gaseosas, S.A. (Spain) where the IRS table has ROA = 24.5% and my table has ROA = 24.3%).
Oligopoly profits
In oligopoly theory, the profit margin depends on two factors—the elasticity of the local market demand (example) for the Coca-Cola licensed products and the market share of the local supply points, which appears to be one (they are local monopolies).
The oligopoly price equation can be posited as:
(5) P = λ C, and the profit markup:
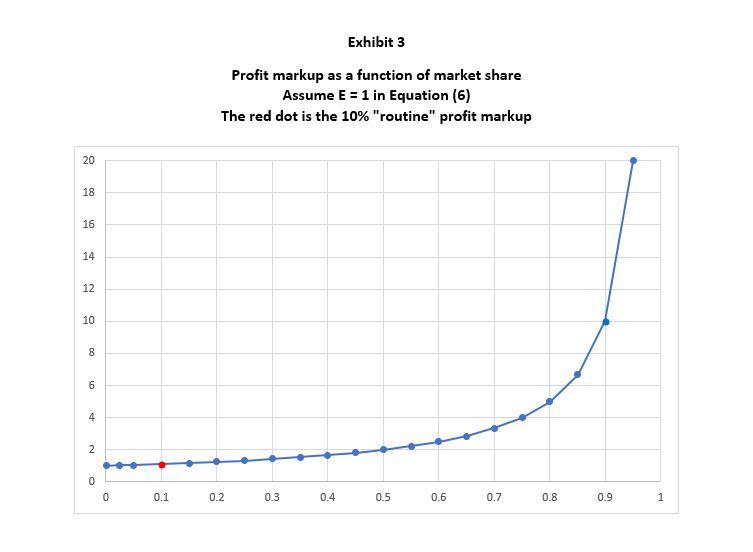
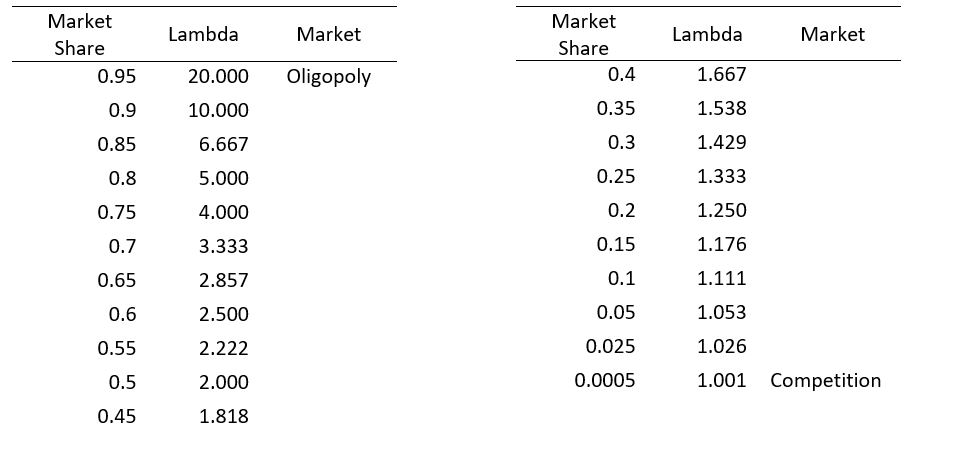
(6) λ = [1 – (M / E)]−1 > 1
where P is the oligopoly price per product (unit quantity), C is the average total cost of the production and distribution of the product, the parameter E is the local market elasticity of demand, and the variable M is the market share of the supply points. See Phlips (1983), pp. 70, 97, 257, Stigler (1957), p. 5 (footnote 19), and Varian (1992), pp. 289-290.
If the market share M = 1, the product market is dominated by a monopoly, such as my reading of the court narrative of facts points to, the local (or regional) supply points.
As the market share approaches zero (M becomes asymptotic, not reaching zero), such that the selected entity has a minuscule share of the market, competition is approached in which λ approaches one, and the unit price approaches average total cost.
I suspect that the “independent” (captive) bottlers, used as comparables by the IRS, benefit from the market shares between the extremes of monopoly and competition. See Exhibit 3 showing that for a given elasticity of demand, the profit markup increases non-linearly with the market share. The red dot on the chart represents the comparable bottlers with the prescribed profit markup of 10%.
Thus, the supply points’ profit margin must exceed the profit margin of the “independent” bottlers, separate from the disputed local enhancement of the US corporation’s owned intangibles and the unnoticed arm’s length compensation for such enhancement under Regs. § 1.482-4(f).
Outsider’s window
My skeptical vista is from the outside, not privy to the court transcripts or expert reports. The court opinion is dense (high content per unit volume), and many economic issues are swept with pungency.
The court rejects the perpetual inventory method (PIM, and not its specific application by a petitioner’s expert) to determine the value of advertising intangibles, calling PIM unreliable; however, PIM is published in academia and is adopted by international organizations such as the OECD. Impugning an accepted economic principle requires more than court script.
The IRS comparables are formed by companies in different countries, ignoring Regs. § 1.482-1(d)(4)(ii) (Different geographic markets). This IRS globalist view about selecting comparables ignores the economic (principle) conditions preventing equalization of return on assets (or preventing the equalization of its two elements, the profit margins and the asset turnover rates).
The economic conditions for the rate of return equalization across different geographic markets are intractable, but on this matter, the IRS is short of economic theory and is an assertive globalist. The court calls the IRS approach conservative, but the narrative shows no such timidity.
Instead of a conservative approach, untested universal gravitation of the heterogenous data underlying the return on assets is asserted, as if entities in Chile, Costa Rica, or Mexico are prima facie comparables to the Brazilian supply point, without any reported data adjustments. There is no economic mechanism ensuring the cross-country equalization of asset turnovers.
None of the IRS “comparables” to the Brazilian supply point was in Brazil, and I suspect that against competent challenges, the IRS implied theory about the return on assets gravitation to a global (reduced to a super-regional rate of return) cannot convince.
Academic idealists and promoters of global trade teach that product price equalization can produce “factor price equalization,” but no realist economist believes in such fantasy. The IRS selection of comparables defies the factors of comparability of Reg. § 1.482-1(d).
The IRS prevailed playing odds by:
- regarding the local monopolies as contract manufacturers, operating under supposed competition with a prescribed routine or low profit margins;
- selecting suspicious comparables (they may not be independent of the petitioner; they may operate at different market levels from the tested parties);
- location savings are swept away, like Kafka’s Gregor Samsa; and
- selecting an unreliable return on assets profit indicator in which the high values of the supply points may reflect their high assets turnover rates (ratios of revenue to operating assets), which are unrelated to transfer pricing. The supply points appear to use very little depreciable assets compared to revenue.
No test of reasonableness was performed (or caught the court’s attention) using unrelated license agreements and the associated range of royalty rates, a major two-players lapse that contributed to the perdition of Coca-Cola in court. Missing relevant information produces bias and does not provide confidence in an opinion.
The DuPont test of reasonableness, using a histogram of a large sample of three-year averages return on assets from companies located in many countries, an unreliable hunt for culprits repeated by the IRS in this case, is unpersuasive. Like in DuPont v. Commissioner, even if ROS are not outliers, the return on assets of the tested parties is inflated by the high asset turnover rates.
This large sample of individual company data (the IRS used 996 companies from many countries) is expected to show a histogram of return on assets with long tales, but the supply points are the only high outliers—which makes me suspicious of the IRS data quality and univariate analysis. See p. 112 of the court opinion.
This IRS win is at odds with certain economic principles (PIM, oligopoly theory) and defies a more robust test of reasonableness about the court-held super-royalty rates.
The Coca-Cola loss sends a distress signal that besides multinational corporate tax base erosion and profit shifting, the court can be another vehicle appealing at confiscating a material fraction of the tax revenue from affected developing countries.
The supply points are in politically weak countries, and thus, I am not surprised that unlike GlaxoSmithKline Holdings (Americas), Inc. v. Commissioner, Docket Nos. 5750-04 and 6959-05, the US Treasury did not interfere in this large (precedent-setting) case.
References
Louis Phlips, The Economics of Price Discrimination, Cambridge University Press, 1983.
Ednaldo Silva, “Location Savings Adjustment to Profits,” Journal of International Business and Economics, Vol. 19, No. 1, March 2019. Accessed at: http://dx.doi.org/10.18374/JIBE-19-1.3
George Stigler, “Perfect Competition, Historically Contemplated,” Journal of Political Economy, Vol. 65, No. 1, February 1957.
Hal Varian, Microeconomics (3rd edition), Norton, 1992.
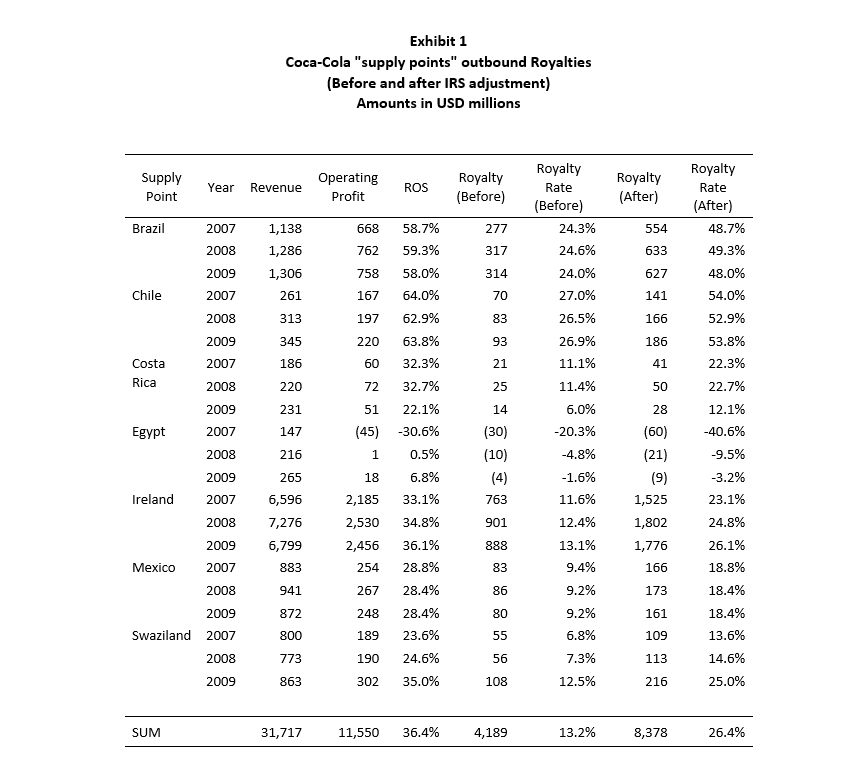
Data source: Revenue (p. 72) and Operating Profit (p. 82) of the court opinion. The remaining columns and the SUM row are my calculations.
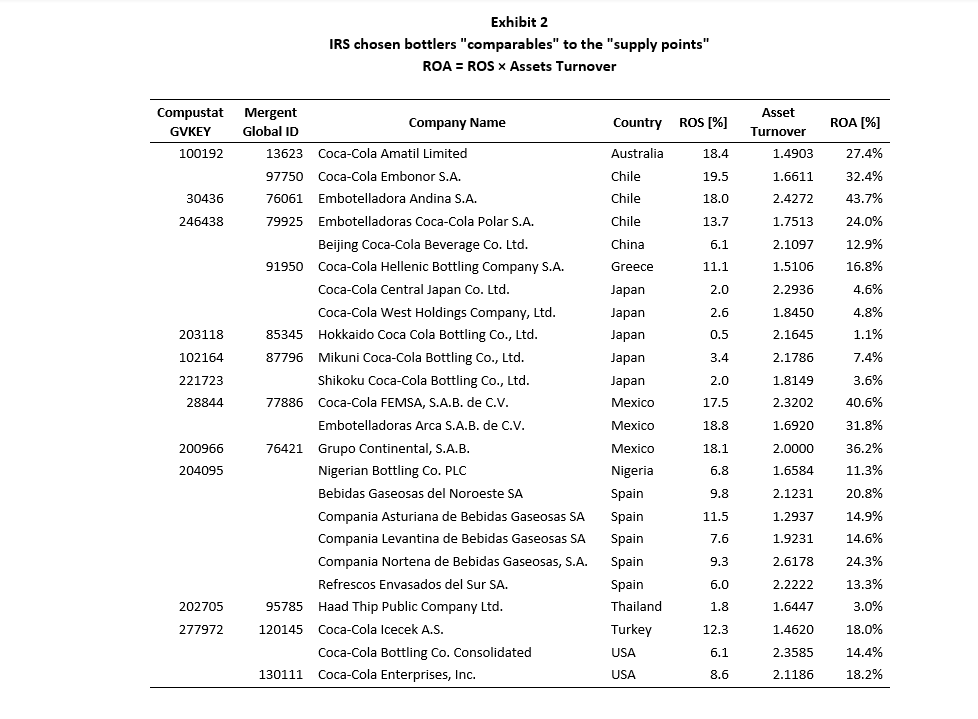
Data source: See pp. 80-81 and 136 of the court opinion.

Ednaldo Silva
Dr. Ednaldo Silva is Founder & Director of RoyaltyStat, a leading online database of royalty rates extracted from unredacted license agreements filed with the SEC.
He is an economist with over 25 years of experience in transfer pricing innovation and the valuation of intangibles.
Dr. Silva helped draft the US transfer pricing regulations as Senior Economic Adviser in the IRS Office of Chief Counsel. He was the originator and developer of the “comparable profits method” and introduced the best method rule and the concept that arm’s length is represented by a range of results. Dr. Silva was also the first economist in the IRS's Advance Pricing Agreement (APA) Program.
Latest posts by Ednaldo Silva (see all)
- US Tax Court decision in Coca-Cola is at odds with economic principles - March 3, 2021
- Transfer pricing and the cumulative advertising effects on sales - January 20, 2021
- The origins of transfer pricing’s comparable profits method - January 6, 2021
- Transactional profit indicators for the TNMM are not viable - December 9, 2020
- A proposed transfer pricing safe harbor for US retailers - November 24, 2020
![]()


Be the first to comment