by Ednaldo Silva, Ph.D.
We analyzed the statistical relation between operating profits and net sales for a large group of US listed companies using RoyaltyStat’s online database of company financials. The results of this study have led us to conclude that the OECD and US transfer pricing guidance on the comparable profits method (TNMM) does not produce the most reliable measure of an arm’s length operating profit margin and that other more informed measures should be considered. Instead of simple regulatory prescription, we apply economics and statistics to reach these conclusions.
Probability Theories
To compute reliable measures of operating profit margin, we must consider probability theories of causation, which is a striking feature of science since Newton (1687). See Wayne Davis, “Probabilistic Theories of Causation” in James Fetzer (ed.), Probability and Causation, Reidel Publishing, 1988. Else see Wesley Salmon, “Statistical Explanation” in Robert Colodny (ed.), The Nature and Function of Scientific Theories, University of Pittsburgh Press, 1970.
In probability causation, we add random errors to an ex-ante relation between dependent and independent variables, such as the simple bivariate cause and effect model:
(1) X Causes Y
For each object X in N (sample size), we have one ordered pair object, Y, forming a general unspecified function:
(2) Y = f(X) + Random error, where
(3) Random error ≈ NID(μ = 0 and σ > o).
NID is an acronym for normal (Gauss) independent distributed random errors; but this normality assumption is not necessary. The expected value of the random errors is null, meaning that errors have a negligible effect explaining the dependent variable, Y.
Empirical Testing
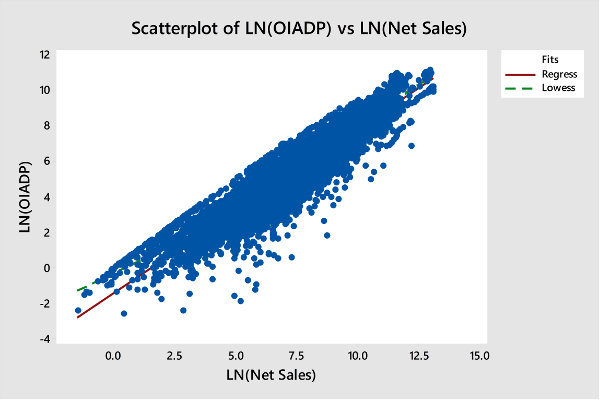
Let (2) represent a positive statistical relation (expressed in natural logarithms, LN) between company net sales and operating profits. From experience, a power function or double-LN model provides a good fit of this economic relation:
(4) LN(Operating Profits(i)) ≈ β LN(Net Sales(i)) + LN(α),
for 1 to N ordered pairs of annual company observations.
In transfer pricing, N is small; however, we can increase the sample size by considering more than three years of comparable company data, a regulatory guidance designed to control for well-known 36-month inventory cycles.
Statistical Relevance
We can determine the statistical relevance of the hypothesis that X Causes Y by obtaining company data to test the rival hypotheses:
Null hypothesis: β = 0, against the
Alternative hypothesis: β ≠ 0.
We apply an accepted statistical decision rule to the empirical results to accept or reject a null hypothesis compared to an alternative:
(i) If β ≈ 0, the dependent variable of (4) is constant (LN(Operating Profits(i)) = LN(α)), and the ex-ante X (net sales) factor is irrelevant to explain Y. A slope of zero indicates that there is no X Causes Y relation.
(ii) If the absolute value (ABS) of the estimated t-statistics of the slope coefficient (β) of (4) is greater than the t-critical (theoretical or tabular) value, which depends on N, we reject the null hypothesis in favor of the alternative hypothesis (that β is not zero), and conclude that a statistical relevant cause and effect relation exists between X and Y.
Given these scientific considerations, the selection of comparables in transfer pricing is important for the estimation of α, β and σ (standard error of the residuals). In this regard, selection bias (also called cherry-picking comparables) controversy can be avoided if the OECD and US transfer pricing regulations allow random samples of comparables instead of prescribed judgment samples.
Operating Profits, Net Sales
Using RoyaltyStat’s licensed distribution of the Compustat database of listed global company financials, we created a large sample satisfying the search criteria:
(a) Country: United Sates;
(b) Years: 1979-2016;
(c) Net Sales > in all selected years;
(d) Operating Profits (OIADP) > 0 in all selected years.
We obtained N = 383 companies in different industries, each with 37 years of data. Using RoyaltyStat’s built-in online regression function, we obtained these results:
(5) LN(Operating Profits(i)) ≈ 0.9265 LN(Net Sales(i)) – 1.457,
for N = 14,593 annual ordered pairs of company data.
Operating Profit Margin
We got high t-statistics of 301.2 for the estimated double-LN slope (β) coefficient, and ABS(63.0) for the intercept. The R2 = 0.861 indicates that 86.1% of LN(Operating Profits) is explained by LN(Net Sales), ceteris paribus.
Outliers exist, but the standardized residuals of (5) are well-behaved and satisfy the assumptions about the residual errors of (3). Given these data, we find strong evidence that the long-term statistical relation between US listed company net sales and operating profits conforms to a power or double-LN function.
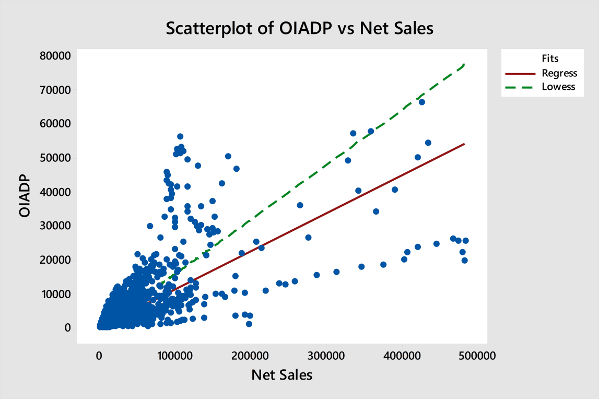
The OECD and US Section 1.482-5 regulations postulate a simple linear function between net sales and operating profits, which we estimated from the same data:
(6) Operating Profits(i) ≈ 0.111 Net Sales(i) + 244.8,
with N = 14,593 observations. The t-statistics is 140.7 for the slope coefficient, and 13.6 for the intercept, measured in million USD. The US and OECD model forces the intercept to zero, which is ill-advised.
Although not directly comparable because the dependent variables of (5) and (6) are different, one is the LN of the other, the R2 = 0.576 of (6) is lower than of (5). But the t-statistics of (6) are also high, providing further empirical support in favor of the alternative hypotheses that company net sales are a strong predictor of operating profits.
Our findings go against prevailing “best practices” because model (5) provides a better fit than (6), as can be visualized by comparing the Lowess and straight-lines through the two scatterplots below, and higher t-statistics (relevance of Net Sales coefficient) of the slope coefficient of (5). The scatterplots confirm that the double-LN function (5) provides a better fit of the operating profits of US listed company data than linear function (6), which is prescribed by tax regulators.
Transfer Pricing Guidance
A policy implication of our findings is that transfer pricing analysts and tax auditors need to go beyond rote calculation of quartiles to provide more reliable measures of an arm’s length operating profit margin and other profit level indicators.
We can start with an examination of the scatterplot of the selected companies’ operating profits vs. net sales instead of imposing a linear relation among these two variables. Also, estimation of the slope coefficient assuming zero intercept is precipitate because this constant may not be zero.
Exploring the bivariate X and Y data by means of scatterplots can help avoid mechanical computation of univariate quartiles of company operating profit margins and aids compliance because the regulatory goal of transfer pricing is to determine controlled (related party) operating profits using the most reliable method.
At RoyaltyStat, we combine listed global company data and interactive multivariate tools, including scatterplot and regression analysis, to make transfer pricing analysis more reliable, and thus more resilient to audit scrutiny.

Ednaldo Silva
Dr. Ednaldo Silva is Founder & Director of RoyaltyStat, a leading online database of royalty rates extracted from unredacted license agreements filed with the SEC.
He is an economist with over 25 years of experience in transfer pricing innovation and the valuation of intangibles.
Dr. Silva helped draft the US transfer pricing regulations as Senior Economic Adviser in the IRS Office of Chief Counsel. He was the originator and developer of the “comparable profits method” and introduced the best method rule and the concept that arm’s length is represented by a range of results. Dr. Silva was also the first economist in the IRS's Advance Pricing Agreement (APA) Program.
Latest posts by Ednaldo Silva (see all)
- US Tax Court decision in Coca-Cola is at odds with economic principles - March 3, 2021
- Transfer pricing and the cumulative advertising effects on sales - January 20, 2021
- The origins of transfer pricing’s comparable profits method - January 6, 2021
- Transactional profit indicators for the TNMM are not viable - December 9, 2020
- A proposed transfer pricing safe harbor for US retailers - November 24, 2020
![]()
Be the first to comment