By Hugo Chary & Thibaut Roques, TP qube, Paris / Bordeaux, France.
The COVID-19 crisis will have a deep impact on our economies, affecting market conditions in most industries.
In light of the arm’s length principle, MNEs must adjust their transfer prices to reflect these new conditions. This issue is particularly acute for transfer pricing policies relying on comparable company searches.
Existing comparable company searches rely on past data, not reflecting the current economic turmoil. As a result, they cannot be relied upon anymore – and shouldn’t, to avoid overpaying taxes and facing significant tax risks.
One way to address this issue is to adjust existing comparable company searches to reflect new market conditions.
This article discusses why some commonly used adjustments do not work and proposes how to compute robust ones.
Adjusting comparable company searches
Due to the Covid-19 pandemic and policy responses around the globe, the world is currently experiencing the worst recession since the 1930s.
MNEs will be compelled to renew their transfer pricing policies to reflect new economic conditions in the light of the arm’s length principle.
Existing transfer pricing economic analyses are usually based on past data that do not capture the new market conditions.
They thus cannot be relied upon, at least without adjustments. This issue is most visible for comparable company searches, mainly performed to apply the transactional net margin method (TNMM), which will be the focus of this article.
Companies relying on unadjusted data are likely to pay too much tax in the next few years. Their transfer pricing policy will continue to reflect a pre-crisis world when margins were higher, risking over-compensating routine entities.
Companies relying on unadjusted data are likely to pay too much tax in the next few years. Their transfer pricing policy will continue to reflect a pre-crisis world when margins were higher, risking over-compensating routine entities.
These transfer pricing policies are also more likely to be challenged by tax authorities in future years, in particular in the country of residence for MNEs granting high margins to routine entities.
Groups relying on pre-crisis transfer pricing policies will be at-risk of a tax audit in the next years, in a crisis/post-crisis context where states will be eager to find additional tax revenues.
“Simple” adjustments of comparable company searches
One way to recompute arm’s length prices and margins is to adjust comparable company searches.
Transfer pricing practitioners were tempted in the 2008 crisis, and will be tempted again in the current crisis, to perform adjustments that are too simple, relying solely on a different computation of the results’ range with the same financial data of comparable companies to estimate the arm’s length range.
We present below some commonly used adjustment methods and explain why these methods are not reliable.
We use a case study with real data from the 2007 crisis to demonstrate the failure of these adjustments.
Commonly used “simple” adjustments and their shortfalls
When relying on comparable company searches, the arm’s length range is most often deemed to be the interquartile range of the comparable companies’ margins (i.e., the 25th percentile to 75th percentile range).
The choice of the interquartile range is the result of a general consensus, leaving some room to set transfer prices while limiting the risks of excesses.
To capture the impact of the recession, three main adjustment methods seem to be preferred by practitioners. All use the same financial data and select a different result’s range to compute an arm’s length range.
Under one method, the min-max range is used, rather than the interquartile interval.
Under the second method, the 10th percentile to 60th percentile range substituted.
Finally, some use a Tukey filter. The Tukey filter consists of computing a new larger range, based on the interquartile range.
Calling Q1 and Q3, the first and third quartiles, the Tukey filter range is simply computed as [Q1 – 1.5 x (Q3-Q1); Q3 + 1.5 x (Q3-Q1)].
(Note that this is not the typical use of Tukey filters. The Tukey filter is usually used to detect outliers. If a data point lies outside the Tukey filter range, it is often deemed to be an outlier point to be discarded. When data are normally distributed, the Tukey filter eliminates approximately 1% of the dataset.)
Flawed arguments
All these adjustments are, however, deeply unfounded. These adjustments do not integrate and hence cannot reflect the impact of the crisis.
The erroneous rationale for applying these adjustments is that companies at the bottom of the range during “good times” look like average companies during “bad times.”
The erroneous rationale for applying these adjustments is that companies at the bottom of the range during “good times” look like average companies during “bad times.”
This is a flawed argument as companies that did not perform well during “good times” did so for different reasons, and the level of underperformance of firms during “good times” is unlikely to be a valid approximation of the typical level of performance observed during “bad times.”
In addition, the impact of the crisis is likely to vary between geographies and industries, which is not captured by the proposed adjustments.
These adjustments also deviate unsoundly from the interquartile range, commonly relied upon, creating a risk in future tax audits. Tax administrations could easily challenge the interquartile range, as the use of the interquartile range is the standard practice.
The following case study of the US auto parts manufacturing industry during the 2008-2010 recession provides empirical evidence that these adjustments do not work.
Auto industry case study
We use data of 30 US companies in the auto parts manufacturing industry (more precisely all listed US companies within the SIC code “3714 Motor vehicle parts and accessories” and with turnover higher than 10 MUSD in 2007), studying their profitability behavior through the 2008-2010 recession.
This case study is particularly relevant since the upstream car industry was strongly hit by the 2008–2010 recession as was the car parts industry and the upstream car industry was bailed out in 2008–2009, which we assume will also happen in the current crisis.
Moreover, car parts manufacturing can be considered a routine activity, and companies in this industry are commonly used as references for computing routine mark-ups.
The graph below depicts the evolution of the interquartile range of return on total costs (RoTC) for this sample of US auto parts manufacturers in the 2004–2011 period.
A table presenting more detailed profitability statistics for the industry throughout the period is displayed in the Appendix.
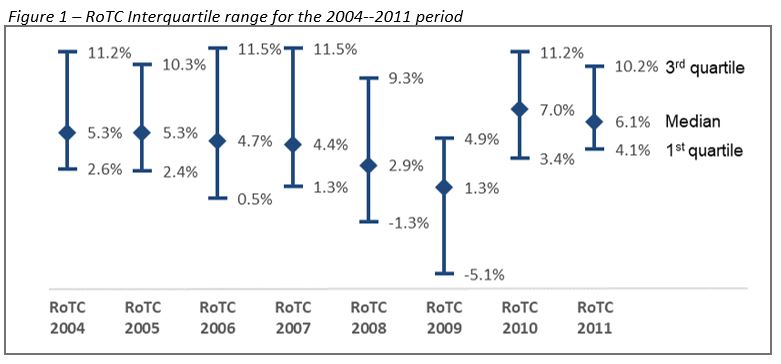
The graph clearly shows the impact of the crisis, with lower 1st quartile, median, and 3rd quartile for firms in the sector in 2008 and 2009.
The firms’ margins then exhibit a rebound, with an increase of the interquartile range in 2010 and 2011, compared to 2008–2009, and even compared to 2004–2007.
This increased profitability was likely driven by the recovery after the recession, policy measures that helped the US automotive industry, and the disappearance of some firms from the panel due to the restructuring of the sector both through M&As and bankruptcy.
We then compare the profitability of this sample of companies throughout the recession (i.e., the reference for the arm’s length range) with the adjusted ranges most commonly used by transfer pricing practitioners.
It is clear from this evidence that the adjusted ranges cannot be relied upon to try to approximate the true arm’s length range.
The graph below summarizes our main findings:
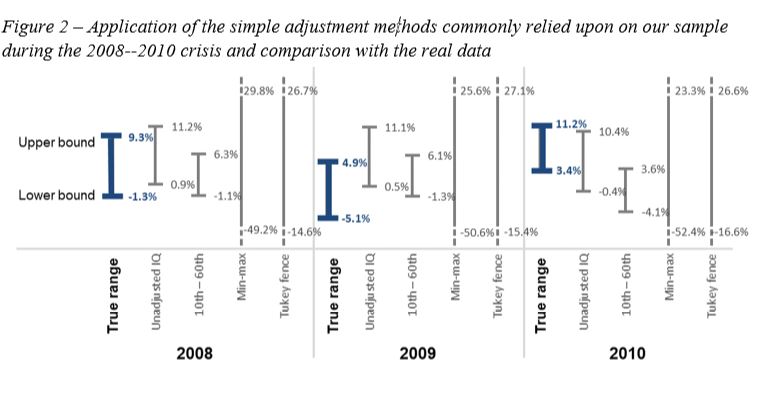
The chart above depicts the lower and upper bounds of the profitability intervals for the “true” interquartile range to be compared with the commonly relied upon adjusted ranges for the years 2008 to 2010 (i.e., the peak of the crisis and rebound).
An adjustment method would be deemed satisfactory if, for each year, the proposed range would be sufficiently close to the “true” range.
As can directly be seen, none of the proposed adjustments closely approximate the true ranges.
In particular, none fares at least as well as the unadjusted range in all years. The min-max ranges and Tukey filter ranges have by far the worst performance and are not even fully displayed on the chart due to their magnitude.
The fact that these simple adjustments do not work is a call to rely on more robust methods.
The fact that these simple adjustments do not work is a call to rely on more robust methods.
We present next some insights to produce sound adjustments to existing searches, allowing MNEs to reuse existing comparable company searches and save costs
Towards sound adjustments for comparable company searches
Comparability adjustments aim to eliminate the difference between the situation of the tested party and the situation of comparable companies.
Here, the primary difference is that comparable companies’ financials predate the crisis and thus have not been affected by it. These financials should then be adjusted.
When the comparable companies and the tested party face the same market conditions, the problem is one of timing. The financial data available do not reflect the crisis, and the goal of adjusting comparable company data is to find a reliable estimate of the future profitability of comparable companies (during the crisis).
It is thus a prediction exercise: the final estimated range should be as close as possible to the “true” arm’s length range that will only be known in a few months or years (this range is also likely to be used by tax authorities in future tax audits).
Stated differently, one wishes to answer the following question: given the comparable company characteristics (its industry, location, financials before the crisis, etc.), how will the company’s profitability be affected by the crisis?
In other terms, one wishes to answer the following question: given the comparable company characteristics (its industry, location, financials before the crisis, etc.), how will the company’s profitability be affected by the crisis?
In other terms, one wishes to answer the following question: given the comparable company characteristics (its industry, location, financials before the crisis, etc.), how will the company’s profitability be affected by the crisis?
There exists a wide range of models to compute these predictions, from very simple ones to sophisticated supervised statistical learning models. All these methods are generally based on the same core assumptions.
First, the behavior of certain financials of the tested party might be an indication of the behavior of comparable companies’ financials during the crisis. For example one can make the hypothesis that comparable companies might experience the same turnover drop as a tested party (typically when performing a benchmark for a routine distributor).
It is then tempting to try to assess the impact of this turnover drop on the comparable companies’ profitability based on their hypothesized levels of fixed and variable costs.
Second, the behavior of companies during past crises can be a proxy for the behavior of companies during this one (adjusting for the fact that the magnitude is likely not to be the same).
Finally, the latest financials (notably quarterly data) from listed companies can be leveraged to estimate the impact of the crisis, although with a lag.
All these methods rely on the same data: firm-level data (estimation of fixed and variable costs changes, change in sales, etc.) and/or macroeconomic data (at country or industry level, measuring GDP, unemployment, etc.).
How to apply these models?
MNEs will need to adjust their transfer prices so that their year-end profitability will be as close as possible to comparable companies.Given the operational constraints of transfer pricing, it is strongly advised to adjust transfer prices as soon as possible and not wait until the end of the year.
This is particularly the case for MNEs paying significant custom duties, which may be cumbersome to recover if transfer prices are not correctly devised. However, as time passes, more and more data points will become available, and the accuracy of the adjusted ranges will improve.
It is thus recommended to use these models twice:
- As soon as possible, adjust transfer prices with the first estimates, to anticipate the impact of the adjustments on custom duties, financing, other transfer pricing flows, etc.
- Towards the end of the fiscal year, perform final adjustments of the transfer pricing policy based on more accurate counterfactual margins.
Adjusting comparable company searches for COVID-19
Adjusting comparable company searches is a cost-efficient way for MNEs to adapt their transfer pricing policy to the current times, and ensure they do not overpay taxes in 2020 nor bear significant tax risks.
Crucially, the accuracy of the adjustments can and should be measured. Transfer pricing practitioners should not rely on dubious rule-of-thumb methods, often with very poor results, for the sole benefit of simplicity.
Bad adjustments will increase tax risks, not diminish them.
Instead, it is advisable to rely on several models (from very simple to more complicated), and to measure the accuracy of each model based on real data (for example, a model calibrated in one industry can be tested in another).
It may not be advisable to rely solely on unexplained black-box models, but it would be a grave mistake to ignore the most accurate adjustment models. 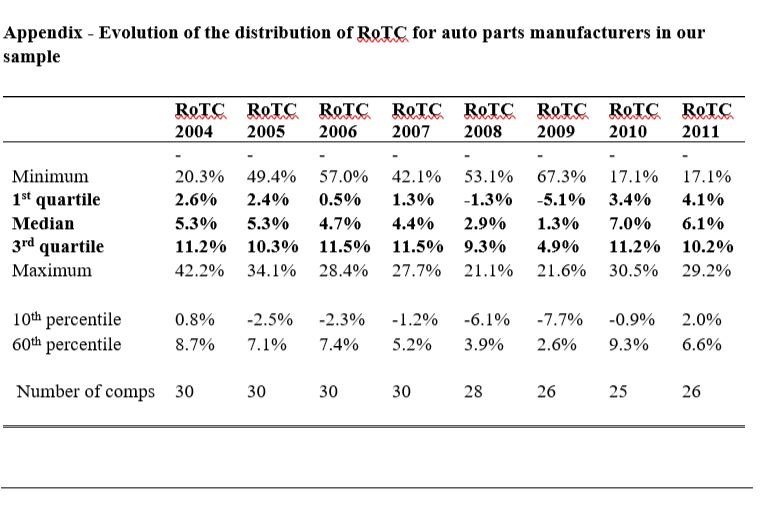

Hugo Chary
Hugo, based in Paris, is a cofounder of TP qube, a start-up pioneering the use of Artificial Intelligence techniques for transfer pricing economic analyses, notably for transfer pricing benchmarks.
Hugo is an economist with a specialization in transfer pricing and economic regulation. Hugo has also developed a strong expertise in data datascience notably in econometrics methods, statistical modeling and natural language processing (NLP). Hugo previously worked at NERA economic consulting.
Hugo graduated from Ecole Polytechnique, ENSAE ParisTech and Sciences-Po Paris.
Latest posts by Hugo Chary (see all)
![]()

Thibaut Roques
Thibaut is cofounder of TP qube, a start-up pioneering the use of Artificial Intelligence techniques for transfer pricing economic analyses.
Thibaut is an economist with a specialization in transfer pricing and statistical modeling. Thibaut previously worked at NERA economic consulting and taught a class at HEC Paris.
Thibaut graduated from HEC Paris (Grande Ecole) and the Toulouse School of Economics (master in economics, mathematics, and econometrics).
Latest posts by Thibaut Roques (see all)
![]()


This was a very interesting article. Thank you for the contribution.