By Dr. Harold McClure, New York City
The Australian Taxation Office (ATO) and an Australian affiliate of US aluminum giant, Alcoa, are locked in a transfer pricing dispute over the price the affiliate charged a related Bahrain company for sales of alumina. The ATO is arguing that the Australian affiliate undercharged the Bahrain company and therefore owes additional taxes equivalent to about USD 921 million. According to a July 9 statement by Alcoa’s CEO, Roy Harvey, the dispute may end up in court.
The case presents interesting questions regarding when comparable transactions should be considered uncontrolled transactions for transfer pricing purposes and how to select the best method for determining arm’s length prices for commodities such as alumina.
Alcoa Australia
Alcoa of Australia Limited (AoA) is a 100 percent owned subsidiary of Alcoa Worldwide Alumina and Chemicals (AWAC), which is 60 percent owned by Alcoa and 40 percent owned by Alumina Limited.
AWAC owns bauxite mines in Australia as well as other nations and refines bauxite into alumina, which it sells to Alcoa and Portland Smelting.
Alcoa is arguing that its intercompany pricing of alumina is arm’s length based on an application of the comparable uncontrolled price (CUP) approach. Alcoa maintains that the intercompany prices are consistent with prices paid by third-party aluminum smelter, Portland Smelting, to AoA.
The ATO, on the other hand, noted that Alcoa owns 55 percent of Portland Smelting, with CITIC Group Corporation and Marubeni each owning stakes of 22.5 percent.
The sales of alumina from AoA to Portland Smelting, therefore, may not qualify as an uncontrolled transaction even if the goods and terms of the sales are comparable to the intercompany sales from AoA to Alcoa, the Australian government argues.
The question of whether the internal CUP is it is a truly uncontrolled transaction is difficult to assess for a variety of reasons.
Alcoa might argue that setting the intercompany price below the arm’s length price makes no sense as that would transfer income from the minority shareholders of AWAC to the minority shareholders of Portland Smelters.
This same argument raises the stakes of this issue, as any ATO success on the intercompany pricing issues raises the prospect of minority shareholder litigation.
External CUP versus TNMM
If the facts suggest that an internal CUP approach is not a reliable means for the evaluation of the intercompany price for alumina, one can debate whether an external CUP approach versus an application of the transactional net margin method (TNMM) applied to AoA is the more reliable approach.
Various sources report third party alumina prices. Charlotte Radford, a reporter for the Metal Bulletin, noted in early 2018:
The alumina market – and the way it is priced – has transitioned over the past 10 years. Fixed-price, long-term contracts, agreed as a percentage of the aluminum price on the London Metal Exchange, have instead transformed into contracts tied to third-party reference prices or indices, including that published by Metal Bulletin. Discounts or premiums are agreed, alongside volumes, for the year ahead, depending on the strength of the alumina market itself, and a month’s business is settled against the preceding month’s index average. An index is a tonnage-weighted calculation of spot market data, giving greatest weighting to concluded spot transactions. Such a way of formatting long-term contracts gives both buyers and sellers rolling exposure to the alumina-specific market fundamentals of the day, and the prevailing spot prices as they adjust accordingly. This transition – the shift from long-term, fixed-price contracts, linked to the fundamentals of the aluminum market – was pioneered by alumina producers with assets in Australia, whose books are now composed primarily of index-linked contracts.
These alumina price indices represent an external CUP. Whether a direct market price comparison can be made or whether certain comparability adjustments should be considered is always a concern with external CUP applications.
TNMM and commodity volatility
In prior publications, I have suggested reasons why a TNMM approach would not be an appropriate approach for evaluating arm’s length prices for commodities such as alumina.
My July 2014 article, Evaluating Whether a Distribution Affiliate Pays Arm’ s-Length Prices for Mining Products (Journal of International Taxation) stated:
Trying to evaluate whether the intercompany price of mined goods is at arm’s length by examining the profitability of a mining affiliate is akin to using a cost-plus approach to evaluate a pharmaceutical manufacturer responsible for R&D costs of new drug applications—swings from enormously profitable in one year to losses in another would be expected even under arm’ s-length pricing.
The volatility of commodity prices is just one reason why a cost plus or TNMM approach would be misleading.
The court decision in Cameco Corporation v. the Queen noted:
Doctors Shapiro and Sarin state that mining companies typically do not enter into cost-plus contracts and do not set prices and therefore are exposed to the risk associated with fluctuating prices. Doctors Shapiro and Sarin opine that Doctor Barbera is incorrect when he states that no profit-maximizing company would accept pricing that did not compensate it for all of its production, exploration and administrative expenses. First, they assert, Doctor Barbera’s statement is contradicted by the fact that most mining companies lost money from 2003 to 2006 … Second, companies do not have perfect foresight regarding future expenses and may sign contracts that cover current expenses but are insufficient to cover future expenses.
Shapiro and Sarin, as expert witnesses for Cameco, were reacting to a TNMM analysis from Dr. Barbera as an expert witness for the Canadian Revenue Agency.
The Canadian mining affiliate was granted a fixed uranium price equal to $10 per pound, which would cover the expected cost of production.
The Canadian affiliate incurred unexpected costs, which the taxpayer’s experts argued would not affect the price of uranium under arm’s length pricing.
A separate issue arose with respect to whether Cameco expected the massive increase in uranium prices that occurred in 2005 and 2006. If so, the intercompany contract that continued to set the price received by the mining affiliate at its expected cost of production shifted the economic rent that this affiliate would have received under arm’s length pricing.
Alumina Limited presents the income statement and balance sheet for AWAC over the 14-year period ended December 31, 2019. Table 1 presents the key items, including total revenue, total operating costs, operating profits, and overall operating assets.
Our graph shows the ratio of operating profits to operating assets – also known as the return to operating assets (ROA) – over this period.
AWAC Operating Profits Relative to Operating Assets: 2006 to 2019
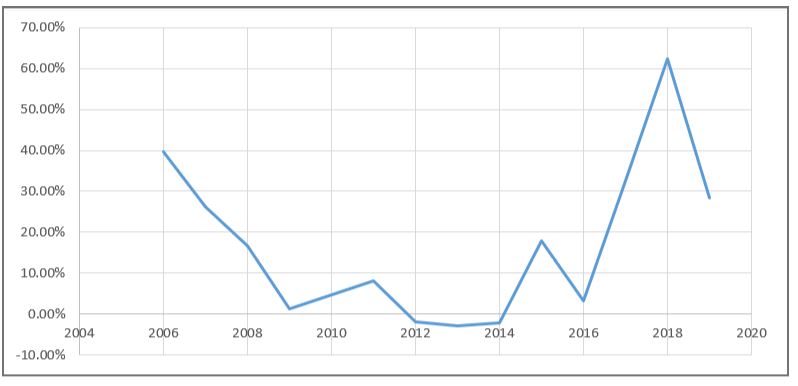
The years 2006 and 2007 were the height of a commodity boom that was interrupted by the Great Recession.
AWAC’s return on assets was nearly 40 percent in 2006, reflecting significant economic rents when alumina prices were very high.
Return on assets was less than 10 percent and was, at times, negative from 2009 to 2014.
Low alumina prices significantly reduced revenue for 2009, but revenues eventually recovered. Operating costs were unusually high over the 2011 to 2013 period. Return on assets jumped to almost 18 percent in 2015 on the strength of high alumina prices and a reduction in operating costs. Alumina prices, however, plummeted in 2016 lowering return on assets to just over 3 percent. Rising alumina prices led to high return on assets for the latest three years, including a return on assets exceeding 60 percent for 2018.
One can reasonably argue that these swings in AWAC’s profitability would occur under arm’s length prices.
The periods when high market prices led to very high profitability is evidence of economic rent, which would be ignored by a naïve strict application of the TNMM.
AWAC total revenue is separately reported as the sum of sales and operating revenue and revenue from related parties. The latter item represents the intercompany sale of alumina to Alcoa.
If all of the former items were truly third party sales, a proper profits-based analysis would segment the overall financials for AWAC.
Since the ATO may be asserting that the sale of alumina to Portland Smelting is also a controlled transaction, whether segmented financial data would be informative is not clear.
Table 1: Key Financial Data for AWAC: 2006 to 2019 (Millions of US dollars)
|
Year |
Sales |
Costs |
Profits |
Assets |
ROA |
|
2006 |
$5,683.1 |
$4,023.1 |
$1,660.0 |
$4,184.2 |
39.67% |
|
2007 |
$5,802.4 |
$4,390.5 |
$1,411.9 |
$5,384.8 |
26.22% |
|
2008 |
$6,309.4 |
$5,284.9 |
$1,024.5 |
$6,123.0 |
16.73% |
|
2009 |
$4,078.0 |
$3,981.4 |
$96.6 |
$7,468.4 |
1.29% |
|
2010 |
$5,456.5 |
$5,084.7 |
$371.8 |
$7,900.6 |
4.71% |
|
2011 |
$6,667.0 |
$6,057.7 |
$609.3 |
$7,560.1 |
8.06% |
|
2012 |
$5,815.3 |
$5,960.9 |
-$145.6 |
$7,333.8 |
-1.99% |
|
2013 |
$5,884.6 |
$6,069.7 |
-$185.1 |
$6,269.2 |
-2.95% |
|
2014 |
$5,862.0 |
$5,970.0 |
-$108.0 |
$5,114.1 |
-2.11% |
|
2015 |
$5,380.4 |
$4,695.1 |
$685.3 |
$3,821.9 |
17.93% |
|
2016 |
$4,057.1 |
$3,935.8 |
$121.3 |
$3,894.2 |
3.11% |
|
2017 |
$5,274.0 |
$3,929.0 |
$1,345.0 |
$4,129.9 |
32.57% |
|
2018 |
$6,749.4 |
$4,407.9 |
$2,341.5 |
$3,756.2 |
62.34% |
|
2019 |
$5,215.8 |
$4,255.9 |
$959.9 |
$3,381.5 |
28.39% |
Sales to Aluminum Bahrain
AWAC also sells alumina to Aluminum Bahrain, which is a smelter owned by the Kingdom of Bahrain and the Kingdom of Saudi Arabia.
The ATO also investigated these sales, which were the subject of a 2014 Securities and Exchange (SEC) ruling that Alcoa had bribed the Kingdom of Bahrain to sell 1.6 million tons of alumina per year. The SEC ruling noted:
By 1996, Consultant A was playing a significant role in the relationship between the AWAC Subsidiaries and Alba. Around this time, Alba complained to the AWAC Subsidiaries that it was paying an above-market price for alumina … The sales staff was concerned that the monies paid to Consultant A come from Consultant A’s markup on sales to Alba, rather than through increased commission payments. An AWA manager was concerned that the monies paid to Consultant A not come at AofA’s expense and that the sales to Consultant A protect our position … It feels like we subsidise the Sheiks and end up with a 5 year outcome that is about $10-15/t lower than the average of the rest of our business…Following the 2001 Extension, AofA stopped selling alumina directly to Alba; all AofA alumina destined for Alba was instead routed through AAAC, which was one of Consultant A’s shell companies. In 2004, AofA entered into another distribution agreement with Consultant A that involved the sale of up to 1.6 million metric tons of alumina to Alba every year through AAAC, which was a shell company of Consultant A. This arrangement lasted until approximately December 31, 2009. The 2001 Extension and 2004 purported distributorship agreements facilitated the corrupt payments by allowing Consultant A to impose an inflated markup on his purported sales of alumina to Alba and used the markup from those sales to enrich himself and pay bribes to senior government officials of Bahrain. From 2002 to 2004, AWA caused Consultant A and AAAC, one of his shell companies to receive in excess of $79 million in markups on alumina sales to Alba … Unlike a true distributorship, Consultant A’s companies never took possession of the alumina, assisted with the shipping arrangements, or otherwise performed any legitimate services for either the AWAC Subsidiaries or Alba. The only function the shell companies provided was to invoice Alba for the shipments at a significant markup … From 2005 through 2009, AWA caused Consultant A to receive in excess of $188 million on the markup of alumina sales to Alba.
While this ruling did not identify the markup received by the shell companies used by consultant A, it is reasonable to assume that these companies received a 5 percent commission rate. This would translate to USD 10 per ton if alumina prices were USD 200 per ton and would translate to USD 15 a ton if alumina prices rose to USD 300 per ton.
The payments during the 2002 to 2004 period averaged over USD 26 million per year, while the payments during 2005 to 2009 averaged almost USD 38 million per year. The period from 2002 to 2009 saw rising prices for most commodities, including alumina.
Table 2 explores the implications of higher alumina prices for the commission per ton if the commission rate were 5 percent. Table 2 also assumes sales represented 1.6 million tons per year and presents the implied commission income for the shell companies used by consultant A.
Table 2: Effect of Higher Alumina Prices on the Commissions Received by Consultant A (US dollars)
|
Alumina price |
$200 |
$250 |
$300 |
$350 |
$400 |
$450 |
$500 |
|
Commission per ton |
$10.0 |
$12.5 |
$15.0 |
$17.5 |
$20.0 |
$22.5 |
$25.0 |
|
Commission income (millions) |
$16 |
$20 |
$24 |
$28 |
$32 |
$36 |
$40 |
The SEC ruling showed some confusion as to whether Aluminum Bahrain or AWAC bore the cost of these commission payments.
If the price paid by Aluminum Bahrain represented market prices, then AWAC bore these expenses. The next question would be whether the mining and refining operations or the marketing division of AWAC bore this expense.
The SEC ruling suggests that part of the payments to the shell companies of consultant A were borne by the marketing division. A 5 percent commission to the shell companies, however, would likely exceed the arm’s length compensation for marketing, especially if the operating expenses of the marketing division were only 2 percent of sales.
The extent of underpricing to the mining and refining operations would, therefore, depend on both factual and economic considerations.
As this controversy moves forward, it will be interesting to see how the ATO approaches this issue. We have strongly argued that TNMM is not an appropriate approach.
If the ATO rejects the taxpayer’s claim that an internal CUP validates its position, then the use of an Alumina Price Index may offer an appropriate application of the external CUP approach.

Dr. Harold McClure
Dr. J. Harold McClure is a New York City-based independent economist with 26 years of transfer pricing and valuation experience. He began his transfer pricing career at the Internal Revenue Service and has worked for some of the Big Four accounting firms as well as a litigation support entity. His most recent employer was Thomson Tax and Accounting.
Dr. McClure has assisted multinational firms with both U.S. and foreign documentation requirements, IRS audit defense work, and preparing the economic analyzes for bilateral and unilateral Advanced Pricing Agreements.
Dr. McClure has written several articles on various aspects of transfer pricing including the determination of arm’s length interest rates, arm’s length royalty rate, and the transfer pricing economics for mining.
Dr. McClure taught economics at the graduate and undergraduate level before his transfer pricing and valuation career. He had published several academic and transfer pricing papers.
Latest posts by Dr. Harold McClure (see all)
- Norway’s challenge to intercompany loan margins for ConocoPhillips and Exxon - April 11, 2022
- Electricité de France v. France: pricing of intercompany convertible and vanilla debt - March 21, 2022
- ATO prevails in Singapore Telecom Australia intercompany financing litigation - December 20, 2021
- Canada and Alta Energy tax dispute: treaty shopping or valuation under restructuring - November 30, 2021
- Australian Taxation Office’s transfer pricing audit of ResMed: an illustrative model - November 12, 2021


Be the first to comment